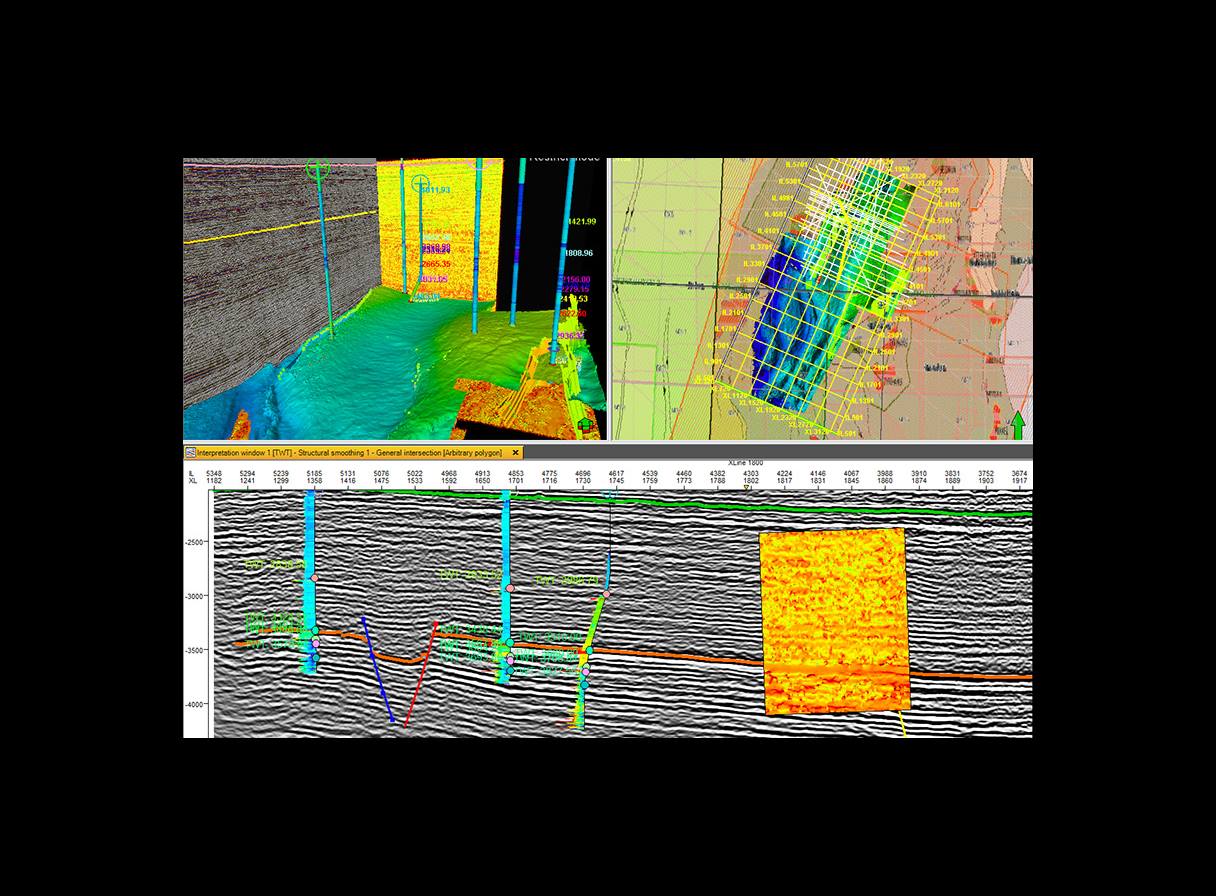
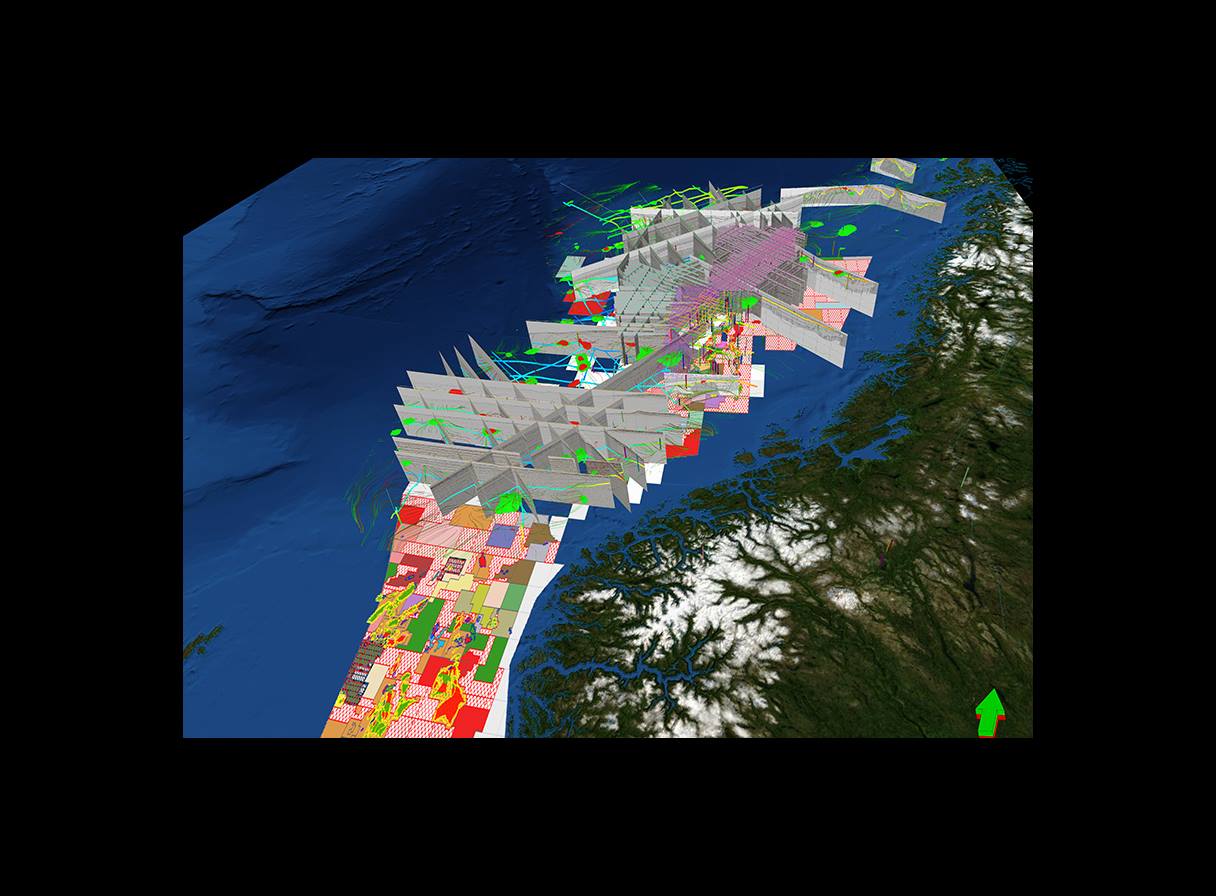
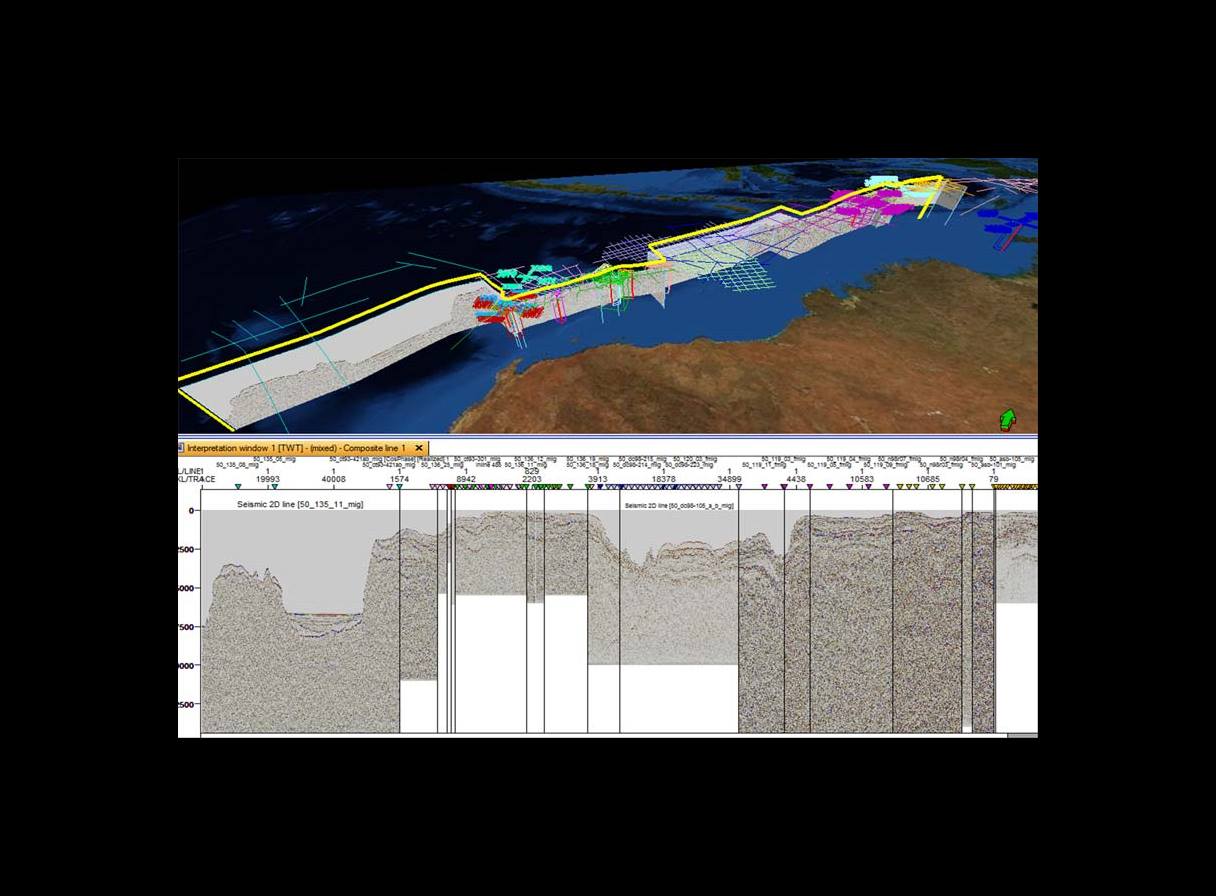
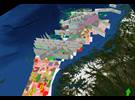
Petrel seismic interpretation enables basin-, prospect-, and field-scale 2D and 3D seismic interpretation and mapping. Users can work with thousands of 2D lines, thousands of kilometers, and multiple 3D vintages and surveys—across multiple coordinate systems with very high visualization performance (GPU based).
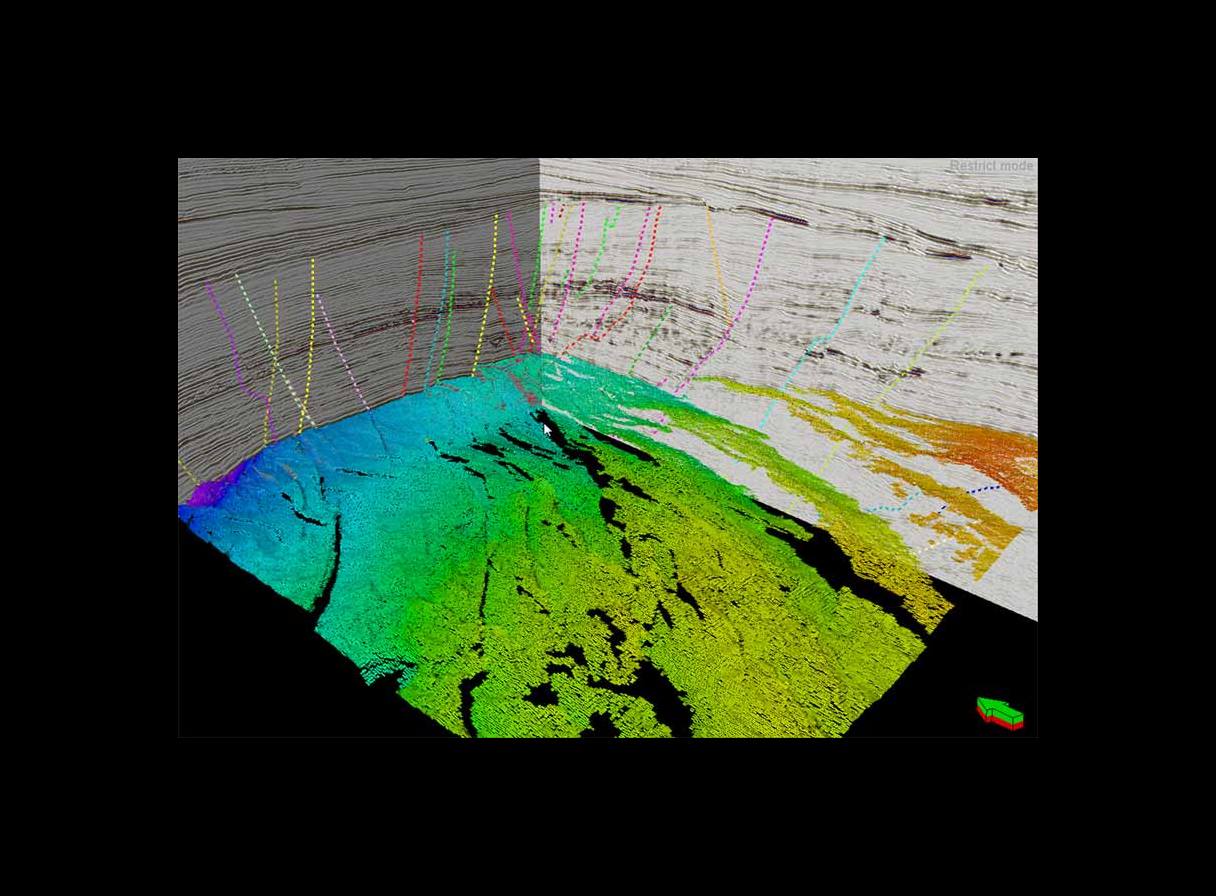
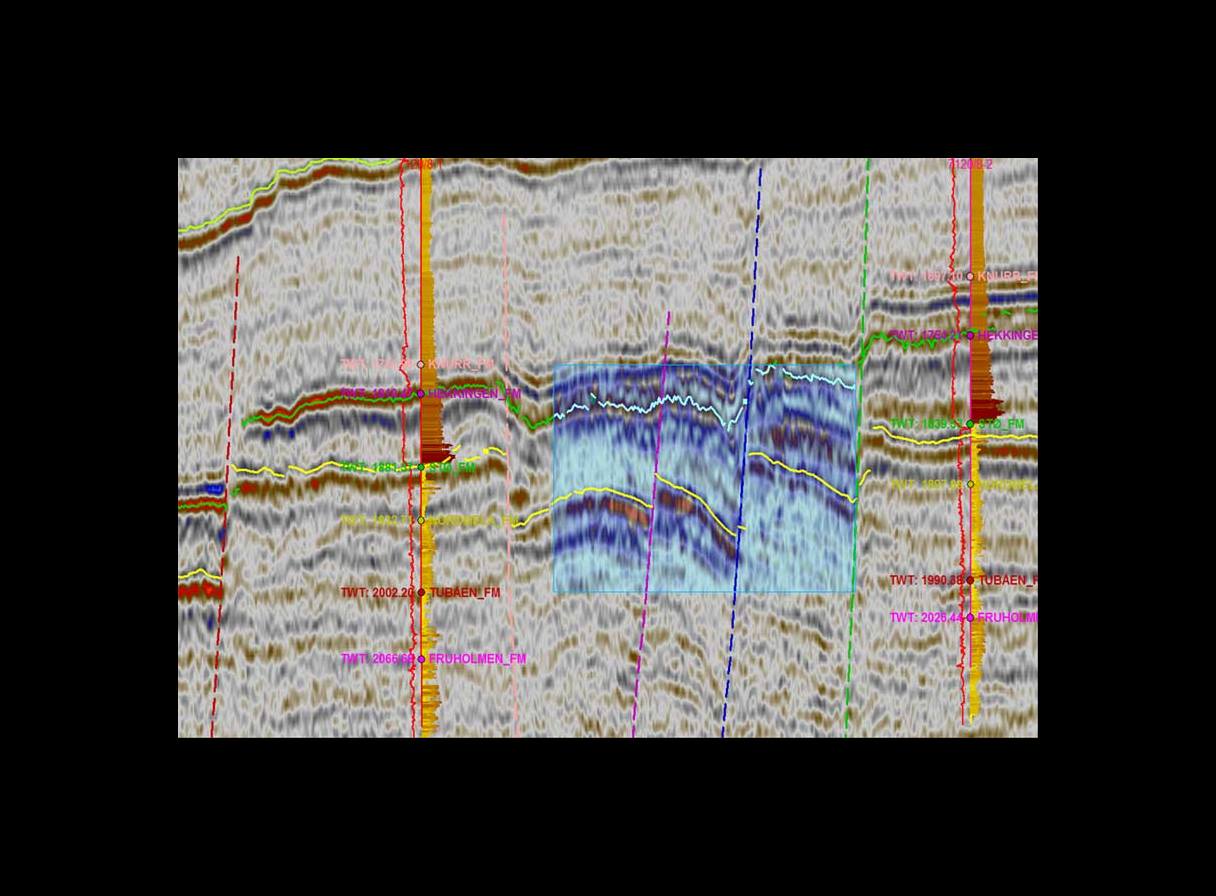
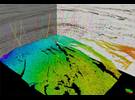
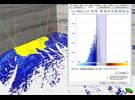
Advanced visualization tools provide seismic overlay and RGB/CMY color blending to enhance the delineation of structural and stratigraphic features. Accurate interpretation of those features is made possible by the complete set of tools, such as advanced horizon tracking, multi-Z interpretation, and interactive mesh editing. Users effortlessly move from seismic interpretation to structural model building using Petrel Seismic Interpretation’s modeling-while-interpreting capabilities.
Features
- GPU-based rendering for high-performance visualization including very large 2D and 3D datasets
- Local flash cache or directional disk cache (network) capabilities, enhancing ZGY seismic visualization performance especially for large volumes exceeding RAM capacity, and therefore significantly improving line-based interpretation workflows
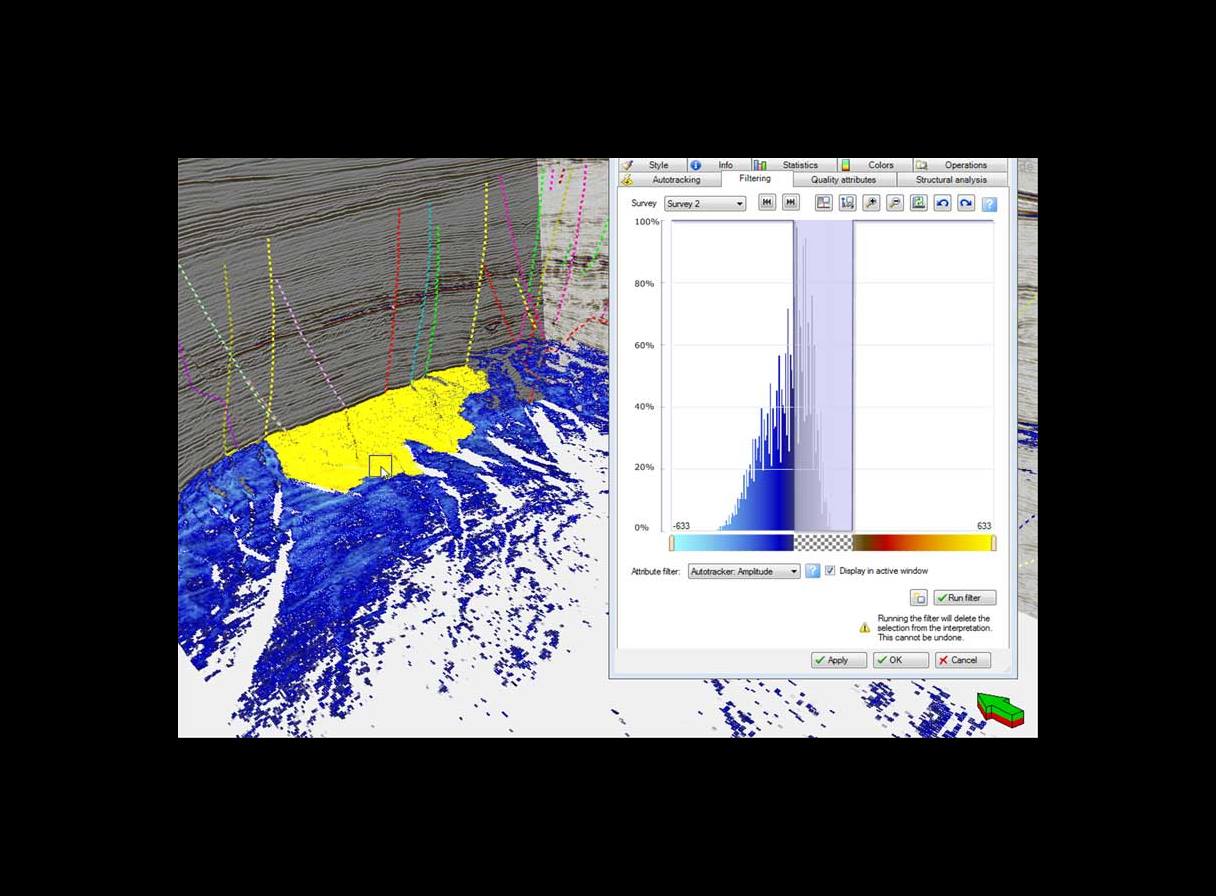
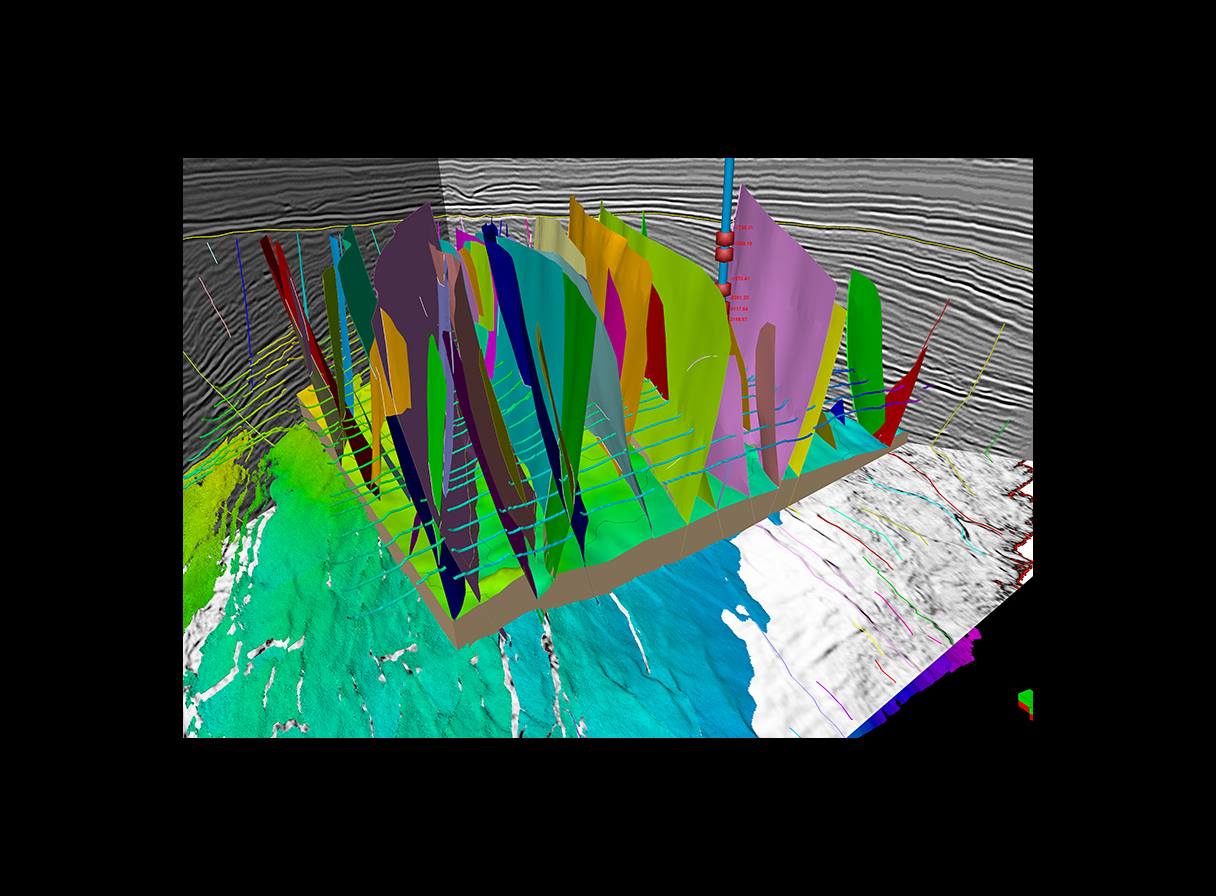
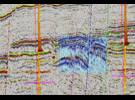
- Horizon and fault multi-Z interpretation tools, including amplitude- and waveform-based horizon tracking, fault tracking, and horizon and surface attributes
- Horizon autotracking enhancements for user and environment preferences, such as paintbrush autotracking or interpolation inside polygons
- Interactive triangular mesh editing for accurate interpretation of complex bodies and geometries
- Seismic overlay and mixer tool for flip and roll visualization, mask, RGB/CMY color blending and data-weighted blending (up to four attributes mixed together)
- Manual and automatic fault contact workflow now available
- Modeling-while-interpreting workflow to create robust and reliable true geological models