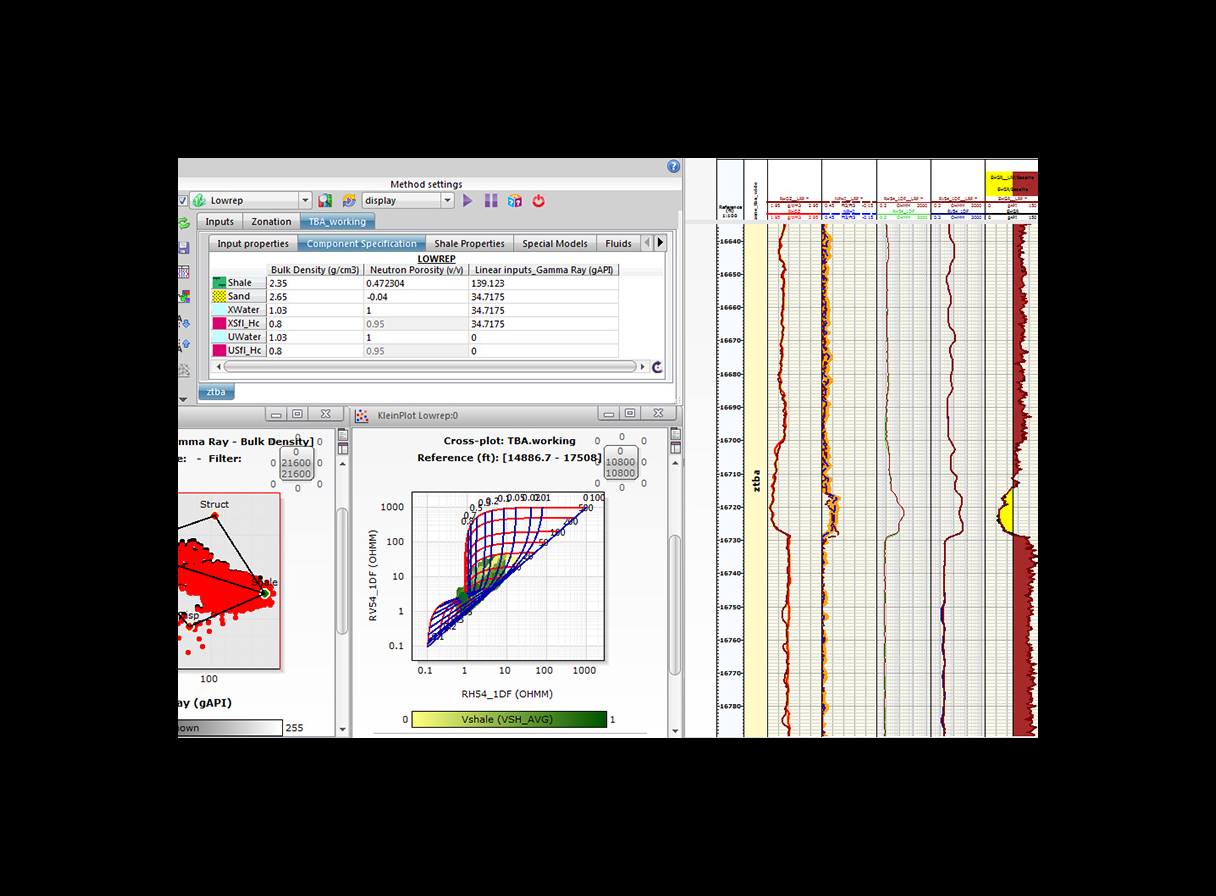
Techlog Thin Bed Analysis module enables you to resolve the challenges presented by highly laminated formations. It allows you to drag and drop curves into the dedicated layout associated with the application. The application control table automatically populates and users can make choices for work streams as well as set fluid parameters.
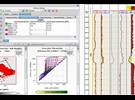
Interactive cross-plots appear automatically, allowing optimization of the Thomas-Stieber control points, and the evaluation is completed using the selected end points. Depth ranges chosen for analysis are controlled by input zones, input flag curve, typing depth ranges, or graphical selection of intervals on the plot.
Solutions
- Deterministic Thomas-Stieber.
- Probabilistic Thomas-Stieber with sensitivity analysis for equivalent hydrocarbon column (EHC) uncertainty.
Model design
Model design is made simple through:
- Input curves selected by drag-and-drop.
- Tabular control screens for clarity.
- Table updates to reflect user interaction (unfeasible combinations of inputs are prevented).
- Thomas-Stieber endpoints (interactive picking facilitates correct choice of parameter values).
- Laminated or isotropic resistivity model options.
Outputs
- Sand fraction porosity and saturation accounting for nonreservoir shale laminations.
- Net sand volume (used to weight volumetric analysis of the sand fraction analysis).
- Detailed automatic depth plots and crossplots.
- Full sensitivity analysis within the probabilistic model.
- Tornado plots (highlighting the main effects on EHC).