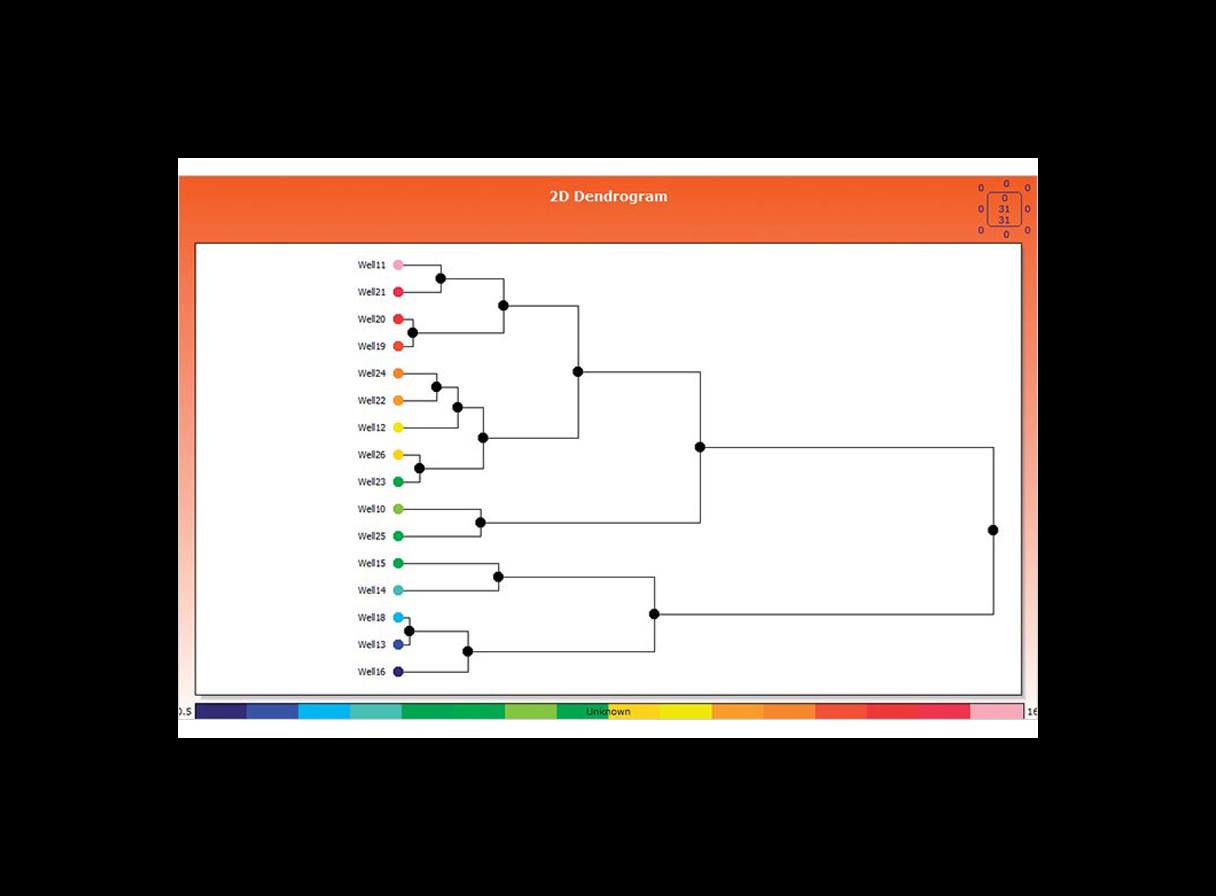
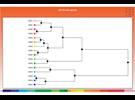
Hierarchical clustering
The Techstat module within the Techlog wellbore software platform allows you to comprehensively review your well data.
- Find similarities between wells.
- Group wells together.
- Align data responses using sophisticated Gaussian analysis, group-by-group among wells.
- Display results in a dendrogram.
Decision Tree
When inputs comprise mixed or incomplete variables (qualitative and quantitative), powerful classifiers can be used. Inputs can be ranked by their information gain, while deduced rules help you understand the input data.
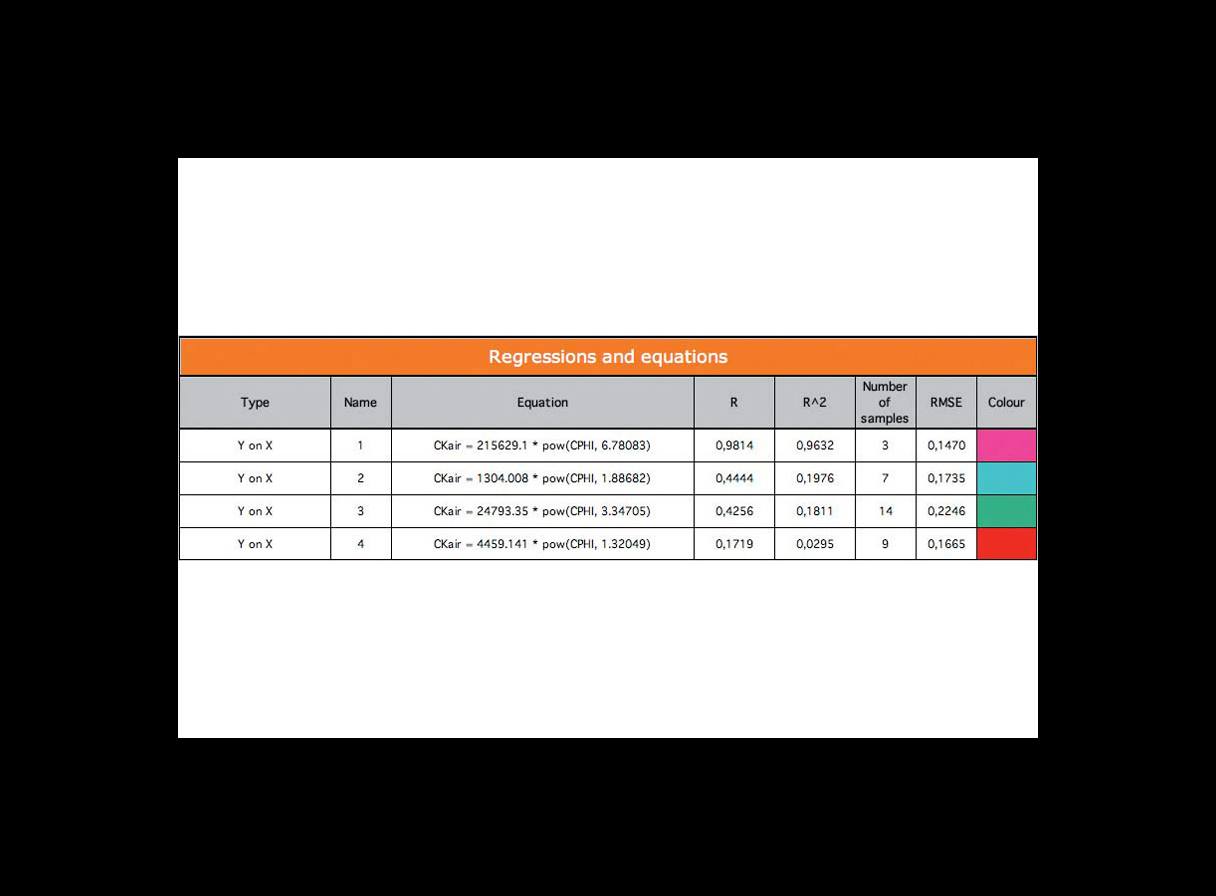
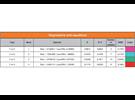
Regressions
The Teschstat module enables a variety of regressions:
- Linear (RMA, Major Axis, x/y, and y/x), nonlinear, and polynomial algorithms are available.
- Regression and other fit lines and functions may be created and conditioned on filters, zonation, well-by-well, or multiwall.
- Fit lines may be calculated for user-defined subsets of data using the data selection tools and the interactivity between viewers.
- Regressions can be freely calculated or forced through a fixed point on a plot.
- User-defined equations can be input graphically or by keyboard entry.
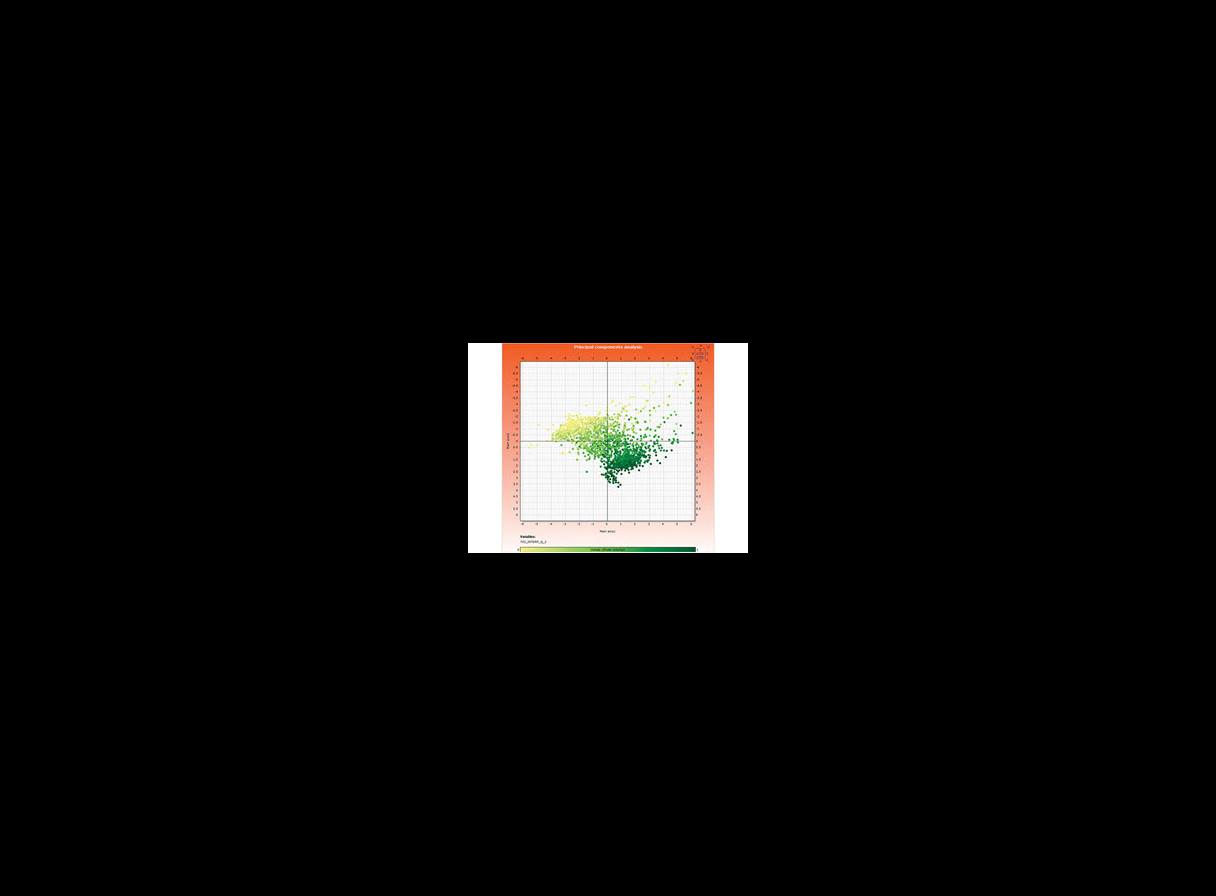
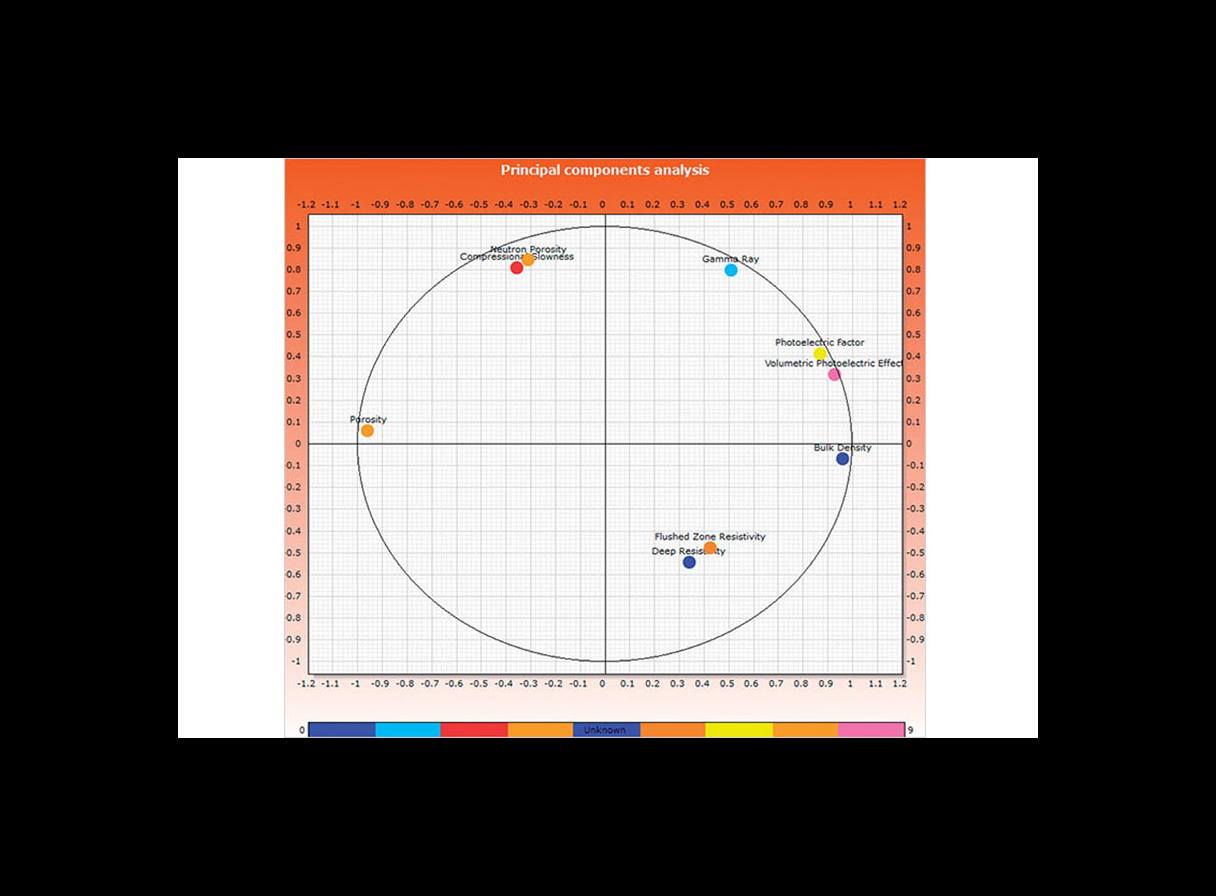
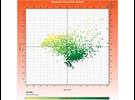
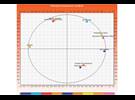
Factor analysis
- Principal component analysis (PCA)—summarizes data, separating the dominating features in the dataset.
- Linear discriminant analysis (LDA)—determines the best projection space to discriminate between two or more naturally occurring groups and clarifies subsequent cluster analysis.
- Multiple correspondence analysis (MCA)—compares qualitative variables that may either be of similar type (observed versus predicted curves) or dissimilar type (geology versus petrophysics).