PetroMod petroleum systems modeling software determines whether oil and gas have been generated, where and how much, when migration occurred, and whether it filled the trap. The software models the burial of source rocks through geological time, from their deposition at the surface until they reach sufficient depth to generate first oil and, eventually, gas as they descend deeper into the Earth. Various components of oil and gas are tracked as they are expelled from the source and migrate upward to fill traps, until either the buoyancy forces break through the seal or the trap “fills and spills” so that oil and gas migrate to other traps. PetroMod software predicts the location of oil and gas accumulations, as well as important properties such as the API gravity of oil, gas/oil ratio, and viscosity.
PetroMod software analysis tools
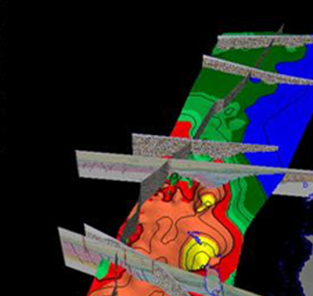
PetroMod software’s 1D, 2D, and 3D viewers provide access to over 100 overlays to enable in-depth analyses of simulation results. Additional tools, such as PetroFlash and PetroReport, provide data for analyses of migration, accumulation, and loss of oil and gas. With the PetroMod software 3D viewer it is possible to simultaneously visualize 2D and 3D models within a modern, object-oriented analysis tool with countless options to combine the model’s geometry with simulation results. Overlays include the following:
- Porosity: primary or secondary pore space or voids within a rock.
- Pore pressure: full range of hydrostatic, pore pressure, and lithostatic pressure information.
- Temperature: distribution with respect to the heat flow history, thermal conductivity of the rocks, and sediment/water interface temperature variation through time.
- Sweeney and Burnham (1990) - EASY%Ro: calculated vitrinite reflectance.
- TR_ALL: quantitative transformation ratio related to total organic carbon and production index for source rocks referring to the expulsion of oil and gas.
- Expulsion onset: first time of expulsion, which depends primarily on heat flow history and assigned kinetics.
- API gravity: density in degrees determined by the American Petroleum Institute.
- Saturation: hydrate, liquid, vapor, and petroleum for the relative allotment of oil, gas, and water in the pores of a rock as a percentage of volume.
- Biodegradation: risk of degradation of accumulated oil and gas.
- Generation of user-defined overlays:analysis of masses and volumes in unconventional reservoirs by creating user-defined overlays with the overlay calculator.
Petrel platform analysis tools
The Petrel E&P software platform provides direct access to PetroMod software’s 1D, 2D, and 3D simulation results. Simulation results are available in the Petrel platform results pane when the user is connected to a PetroMod software project.
Results viewing in the Petrel platform include:
- Visualization of 3D overlays through geological time as grid properties including access to the Petrel platform’s property calculator, 1D extractions along the wellbore, and display in the well section window.
- Display of seismic and well data together with the petroleum systems simulation results for validation of simulation results.
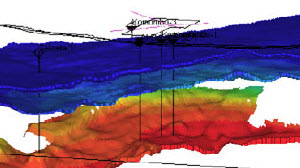
- Visualization of hydrocarbon accumulations through geological time, including flow paths or migration stringers, and properties and composition through geological time.
- Visualization of 2D models and node-based overlays in a 3D window through geological time.
- Extraction of 2D results from a 3D model along polygons or intersections.