OFM 26.1 Now Available
Wednesday, 11 November 2026
OFM™ well and reservoir analysis software gives managers, petroleum engineers, and geoscientists quick access to the information they need to analyze performance and make timely decisions.
It provides an integrated, cost-effective environment to:
OFM software supports:
OFM 26.1 introduces new and exciting modules, together with quality upgrades and enhancements on current modules. A few highlights are listed below.
The new release also delivers several smaller, but useful, enhancements across various modules.
For information on database compatibility and other requirements, please refer to the Installation Guide.
OFM 26.1 adds a new Deviations viewer to the Analysis Dashboard window (Figure 1), which can be used to view wellbores and lithology. The Edit menu provides an individual 2D view, 3D view, a Gun Barrel Chart, and Spacing Report formats. The Deviations module supports Lat/Long, UTM, and SPCS coordinate systems.
The 2D Deviations view provides an overhead view of the wellhead location, the deviation, and an underlying GIS layer.
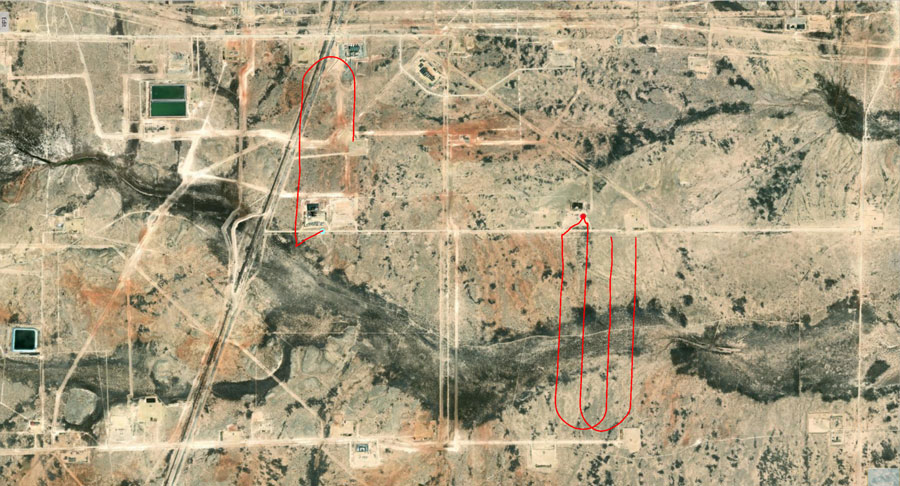
Figure 2: The 2D deviations analysis with an underlying GIS layer.
The 3D Deviations view shows deviation data for one or more wells by using a 3D coordinate system. It can also include lithology and perforation sections.
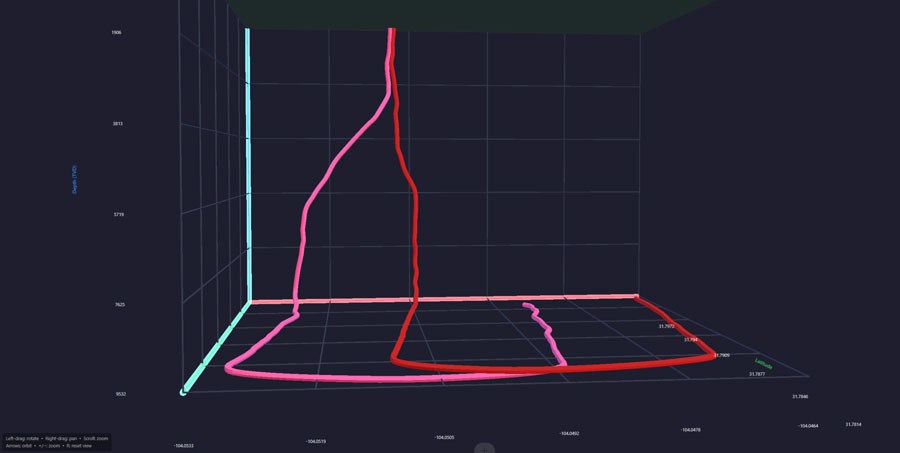
Figure 3: The 3D deviations analysis showing two U drill laterals.
The Gun Barrel Chart analysis for well spacing takes the cross section of a group of wells, from the viewpoint of the end of the laterals, and calculates the distances between the laterals.
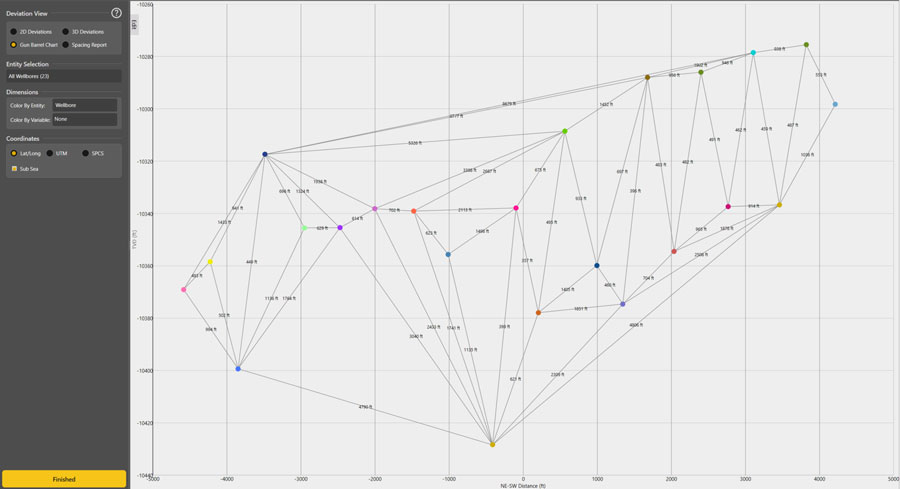
Figure 4: The Gun Barrel chart showing the well spacing for a group of horizontal wells..
The Spacing Report starts with a selected reference wellbore and displays the calculated distances from the other wellbores in the filter. The Formation Interval Crossed column represents the status of the wellbores in the lithology layers. One wellbore in the top lithology layer, and the other wellbore in the bottom lithology layer will be true; otherwise, it will be false.
The new Correlation Matrix allows you to select multiple variables for a group of completions and determine how strong the correlation is for the pairs of selected variables. OFM software provides the Pearson and Spearman correlation methods.
The values range from -1 to +1. Values closer to ±1 indicate stronger relationships.
|
Value |
Description |
|
+1 |
Perfect positive correlation |
|
0 |
No linear correlation |
|
-1 |
Perfect negative correlation |
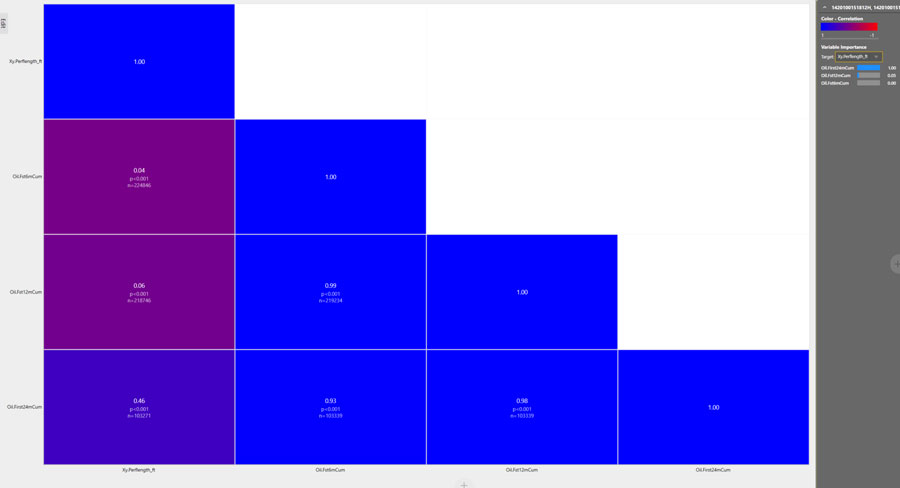
Figure 5: The Correlation Matrix analysis showing the correlation strength of four variables.
For the Pearson correlation coefficient, your data is continuous, follows a normal distribution, has no major outliers, and the relationship between variables is linear.
For the Spearman correlation coefficient, your data includes ordinal/ranked categories, is heavily skewed, contains extreme outliers, or exhibits a non-linear but monotonic trend (like a consistent upward curve).
The Spearman correlation coefficient converts the raw data of X and Y into ranks (for example: 1st, 2nd, 3rd, and so on) and calculates the Pearson correlation coefficient of those ranks.
This section includes several smaller enhancements across several modules.
Cross sections
The new OFM software release allows you to view cross sections in your OFM software dashboard. You can use this function when lithology data is available in your user projects.
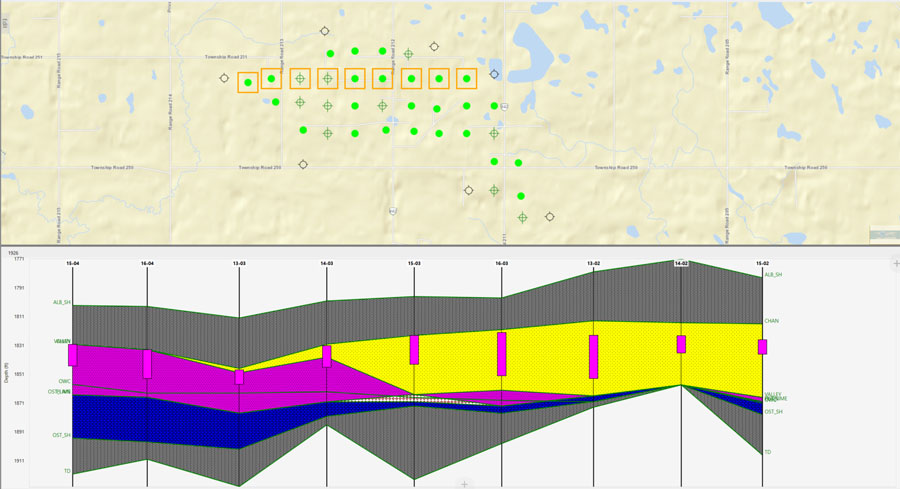
Figure 6: The Well Log Cross Section analysis displaying the lithology and perforations for nine wells.
Line and scatter charts
You can now include crosshairs with your line and scatter charts. In the Properties Inspector, the vertical and horizontal lines can be switched on or off.
Line charts
Bar charts
The Waterfall bar chart has been redesigned, and a Total bar is now available to represent the total volume of the series. The Waterfall chart can be used with one or multiple variables.
Chart annotations
An email button has been added to the Annotation table, allowing selected annotations to be sent directly in a new email. Titles and subtitles You can now include titles and subtitles for Mapping Analyses. Shapefiles OFM software now supports ShapeFiles in UTM and State Plane Coordinate System (SPCS) coordinates. File paths You can now save file paths to PDF files. The OFM software Print Manager is not compatible with Adobe PDF. SLB recommends Microsoft Print to PDF or Microsoft XPS Document Writer instead. The Print Manager does not print pie charts correctly (images are distorted). However, you can print directly from a chart. Select the desired chart and right-click to access the print function without going through the Print Manager.
Mapping
File manager
Notes
Print Manager


