A new approach
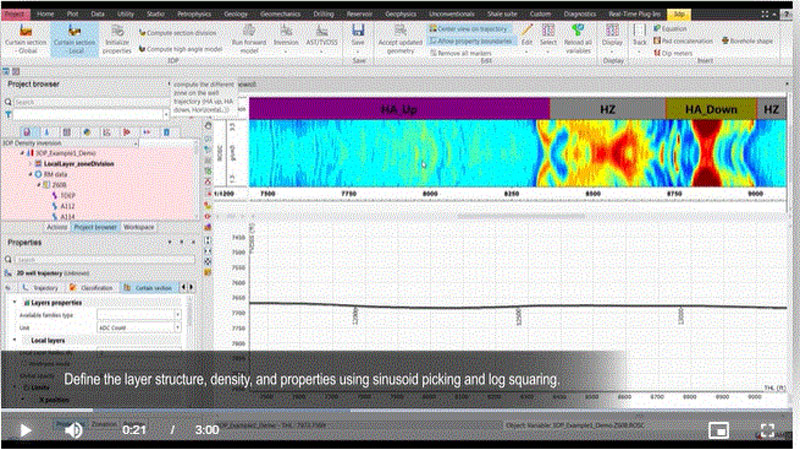
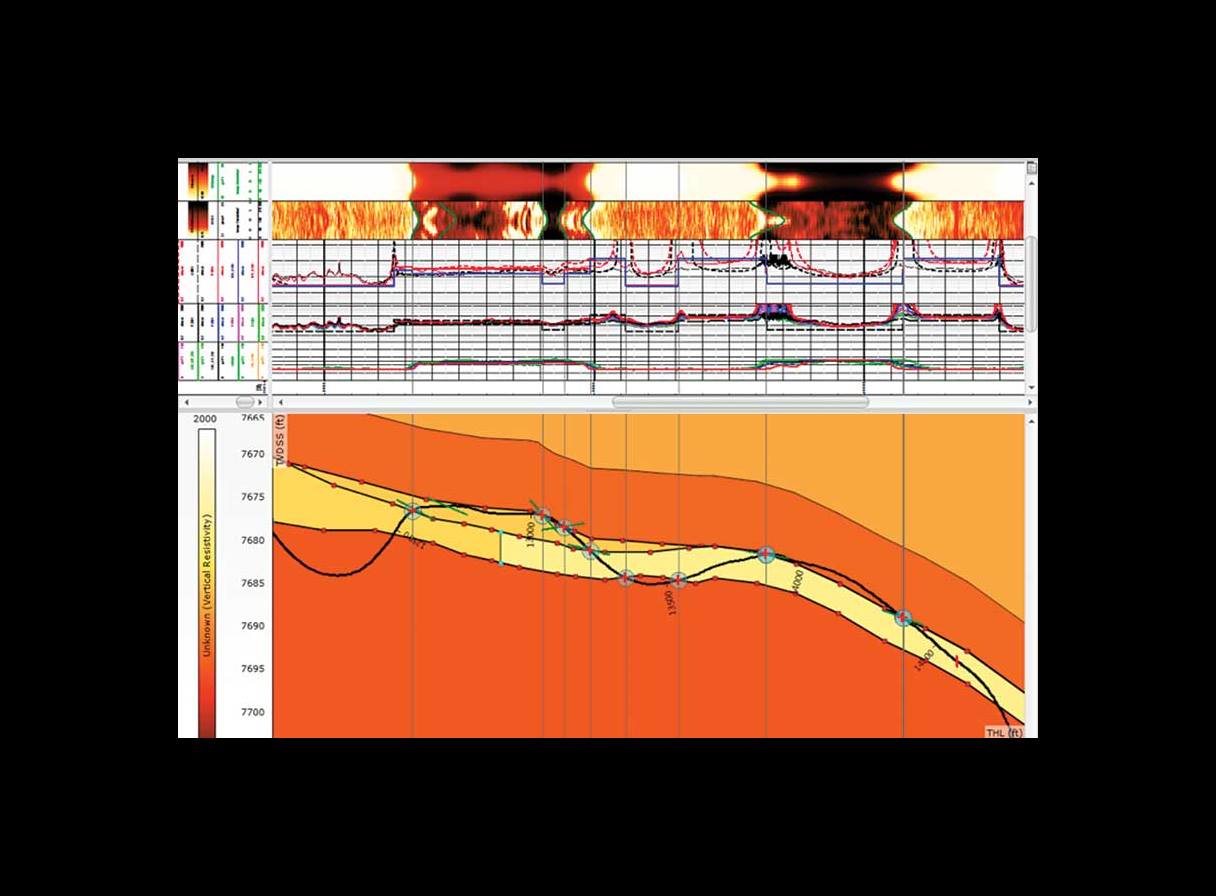
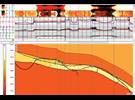
The graphical capabilities in Techlog wellbore software enable a new workflow for valid interpretations in HAHz wells. The measurements acquired in the HAHz well are used to define the formation geometry around the well and populate the layer properties. External sources of geometrical models or remote bed boundary inversion maps may be used to enhance understanding of the formation geometry around the well. The overall goal of the interpretation is to determine the position and properties of each layer that is traversed by the well.
As the formation properties determined by the workflow are free of the most common geometric effects in HAHz wells, they can be used in the same petrophysical calculations and workflows applied to vertical wells in the field or reservoir.
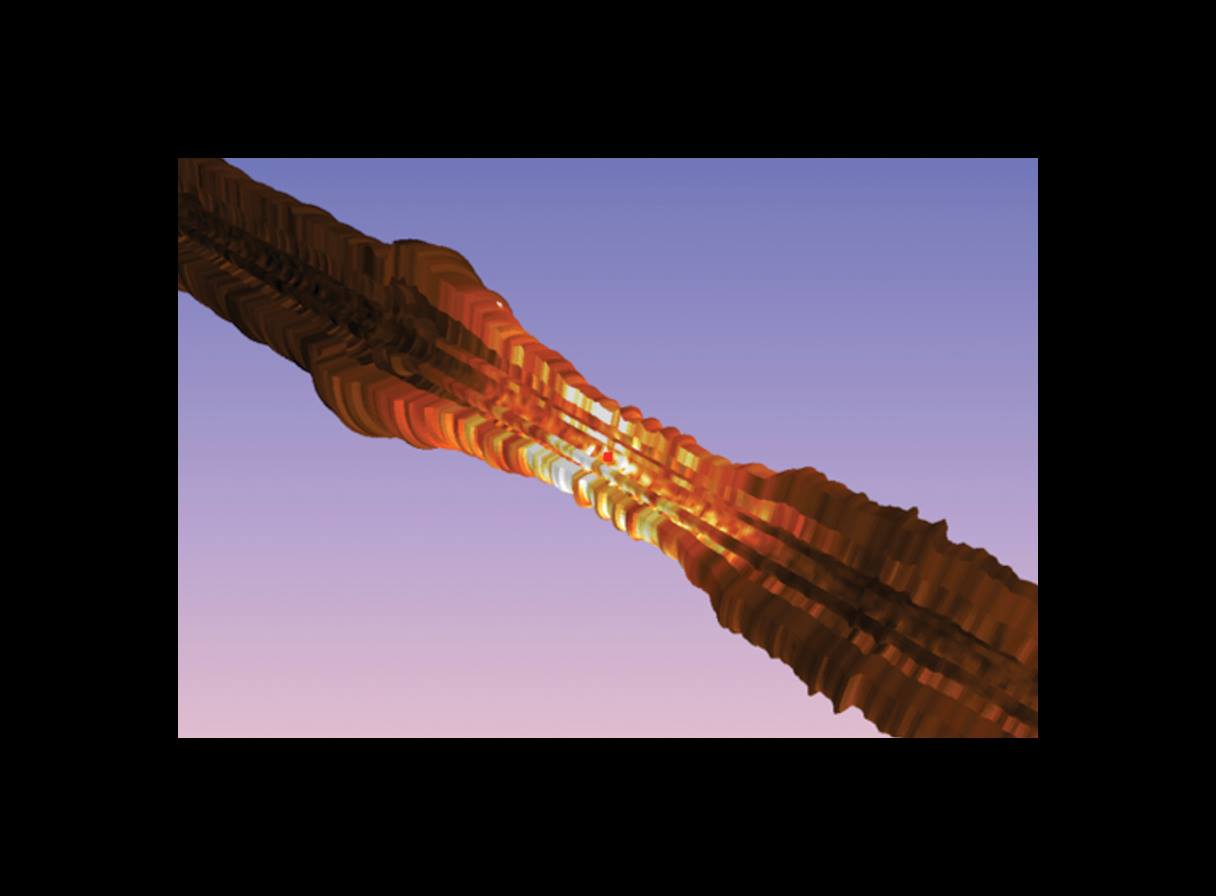
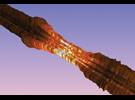
The Wellbore Centric Grid display
The 3D Petrophysics module for HAHz includes a new feature to display visualization of complex azimuthal and radial information around the wellbore trajectory. Boosting understanding, and analysis, the Wellbore Centric Grid display provides a platform for azimuthal petrophysics.
Interpretations you can trust
Geometrical effects are observed on log responses in almost all HAHz wells. Previously, the industry was lacking a readily available interpretation methodology to tackle this very common phenomenon. This new Techlog workflow addresses the most common geometry effects observed in HAHz well logs. Now, petrophysicists can efficiently extract the full value from acquired measurements to make interpretations they can trust.
Features
- Intuitive drag-and-drop interface.
- Integrated dip picking.
- Flexible and comprehensive model-building tools.
- Efficient and fast creation of forward models.
- Practical workflow to refine the model.
Benefits
- Extract the full value from your acquired measurements.
- Validate models of both subsurface.
- Make petrophysical interpretation you can trust .
 >
>