The Field Map module enables users to perform the following:
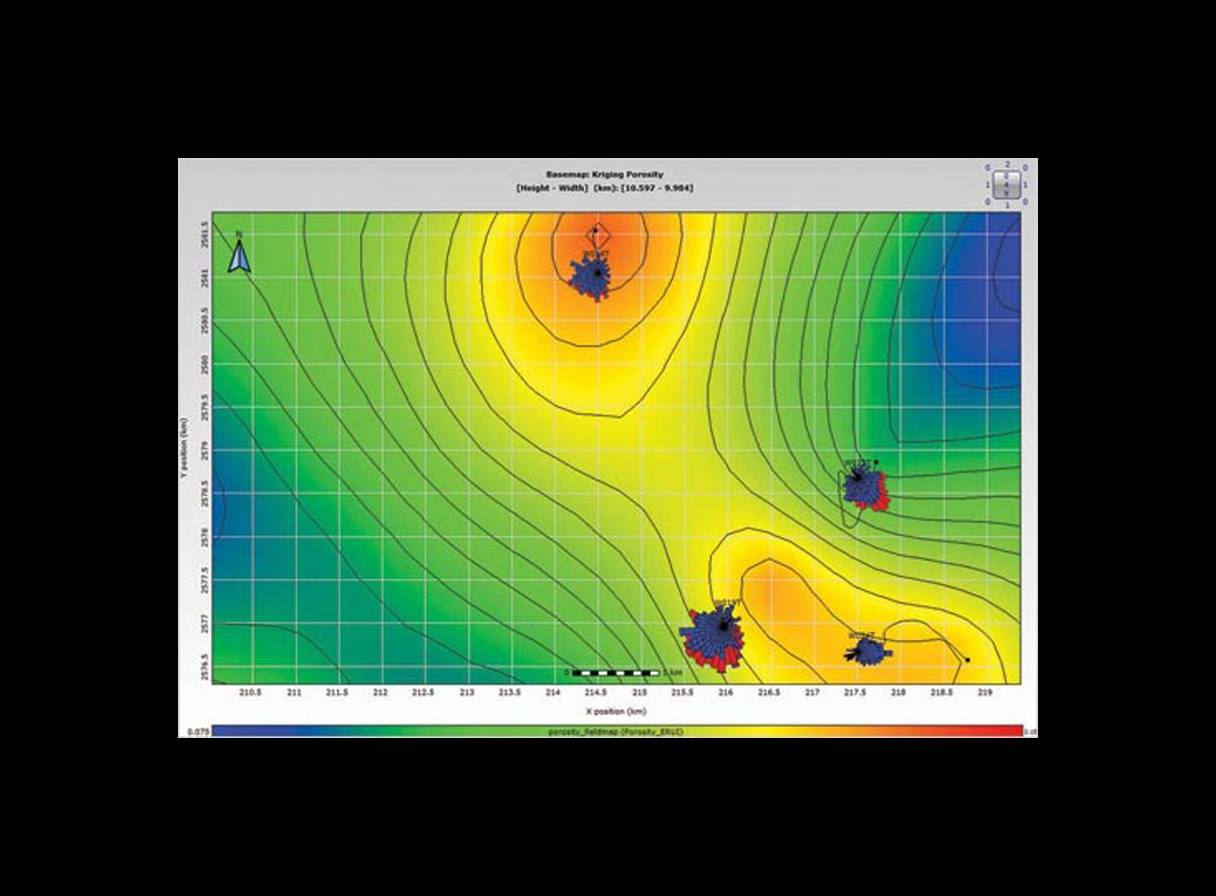
- Display the desired set of wells in a 2D map viewer via drag-and-drop from the Project Browser; well symbols (oil producer, gas injector, etc.) are retrieved from the project data store as a well property.
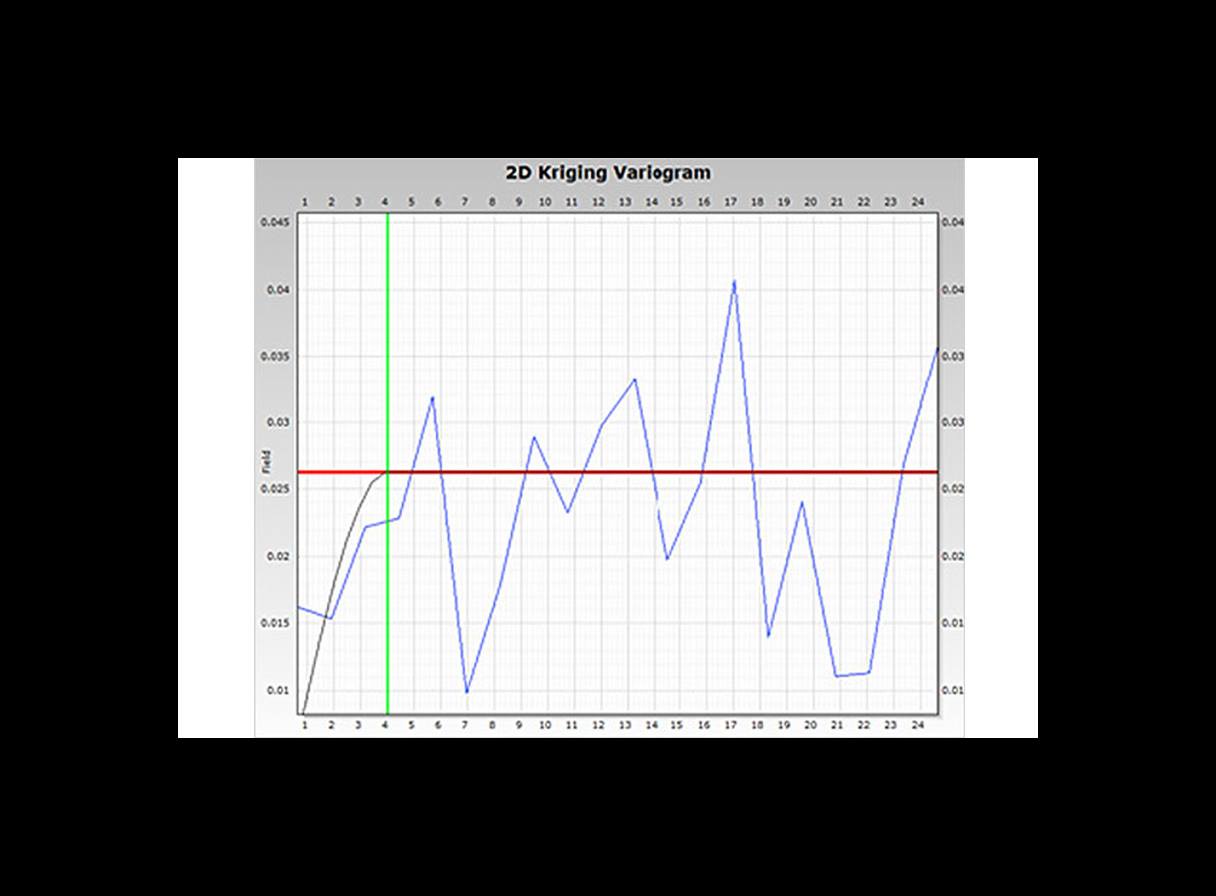
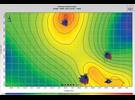
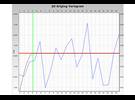
- Compute any chosen value or parameter from the well logs, cores, or results as a surface, using kriging as the contouring algorithm; interactive adjusting of the variogram parameters to investigate data uncertainty across the field or project can also be performed/
- Directly retrieve the data to be mapped from the results of the summaries computation (e.g., average petrophysical property by zone or fluid zone).
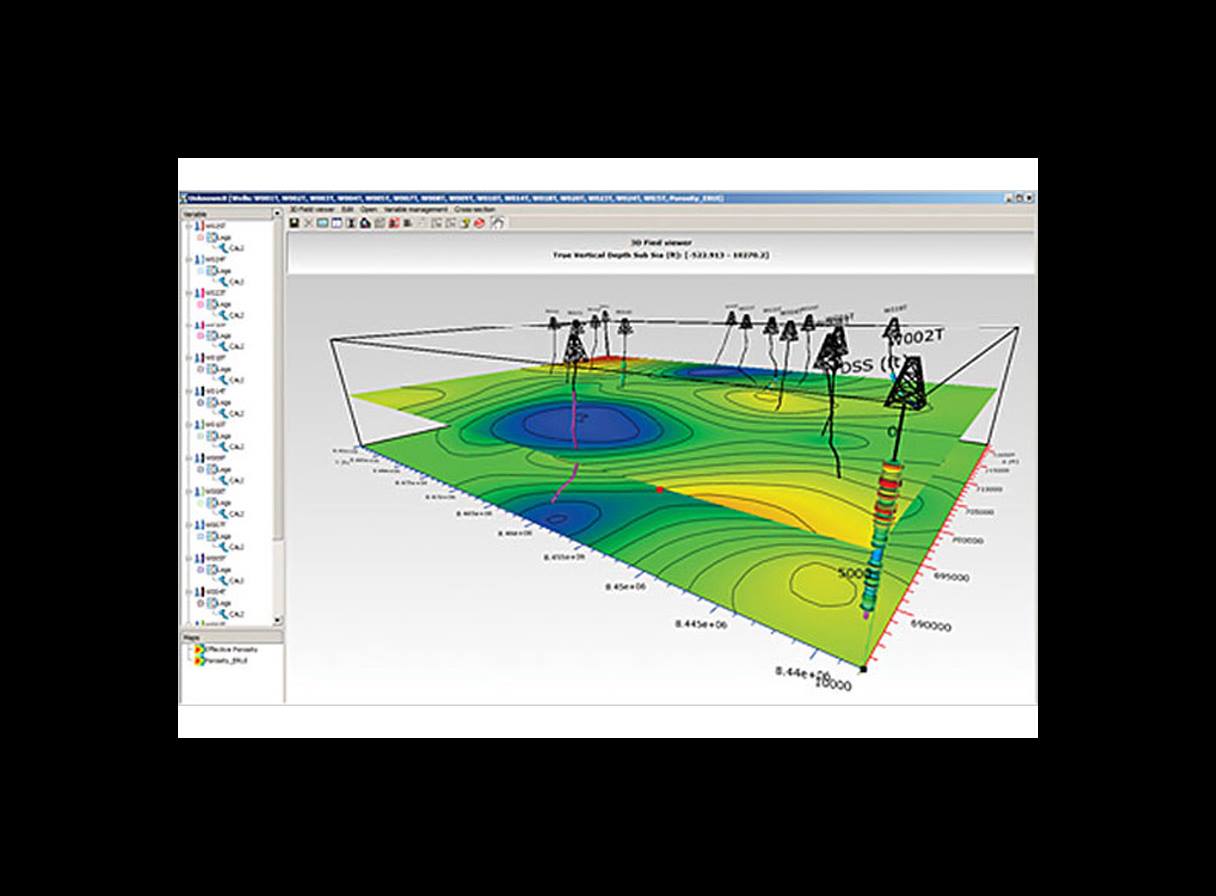
- Place the mapped values at the actual X, Y locations of the zone represented by the map, based on well deviation and depth-to-surface; well trajectories may also be projected onto any map.
Graphics capabilities
The Field Map module allows any image to be applied as a background. Well positions can also be represented by a symbol or a plot image (such as Stereonet).
2D map outputs
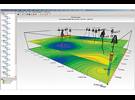
Finished maps can be easily saved and then instantly retrieved, printed, or displayed within the 3D Vue module.
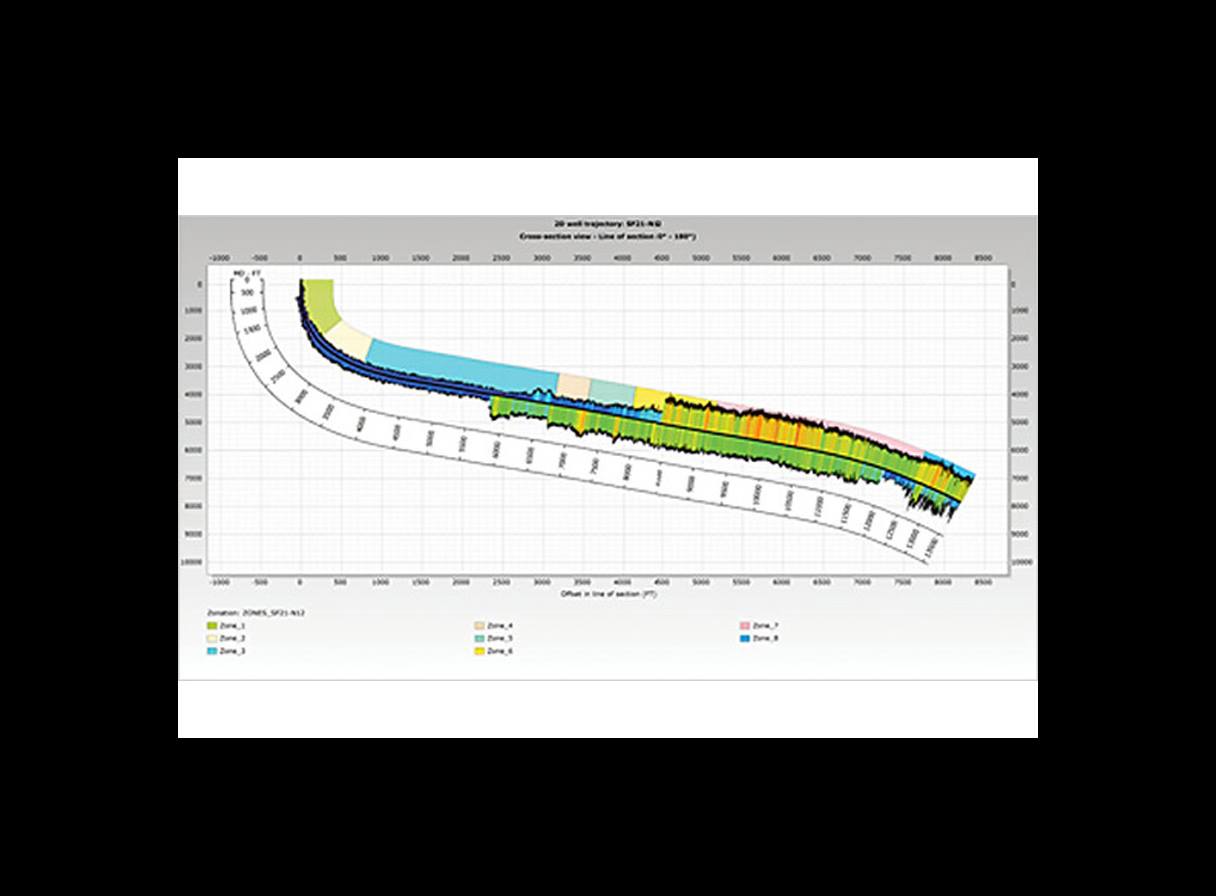
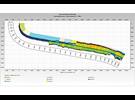
2D well trajectory
The Field Map module features a trajectory plot tool. This provides a 2D representation of your well trajectory, plotted with logs and zones.