Techlog Latest Features - 2023.1

New Python application programming interface (API) and bug fixes

Using the Python API, you can now access, manipulate, and get information about the different components of the application workflow interface (AWI) or any Python AWI
Bug fixes and stabilization of Python APIs
Python Editor update: there is now more space in the coding area. You can collapse any unused parameter definition, description, and output sections
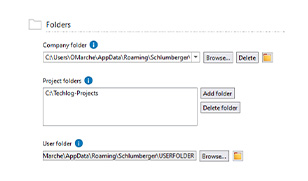
Shortcuts in few key places to reach folders in windows explorer faster
Work on user experience improvement continues.
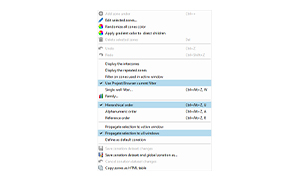
You can now filter global zonation based on the filter in the project browser
The global zonation selection is not lost when you click an empty space in the dock window
There have been improvements made to the graphical editing zones of LogView when using the extend option and multiple zonation tracks
There have been bug fixes to zonation to make it more stable and increase performance
Kerogen properties
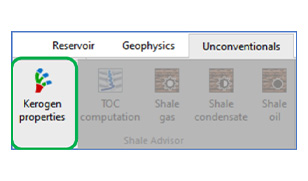
You can now compute a consistent set of kerogen properties from a single estimate of thermal maturity. The outputs are primarily used as end points in Quanti.Elan. This new method enables thermal maturity adjusted log interpretation (TMALI) in unconventional reservoirs; and helps to perform more accurate and confident interpretation of porosity, saturation, and hydrocarbon in place in organic-rich shales.
Initialize local layer geometry from dip set.
You are now able to initialize local layer model geometry from dips, through an automatic workflow. This expands the local layer model initialization workflow from LWD images to any dip set.
Pixel inversion processing (PIPER) upgrades.
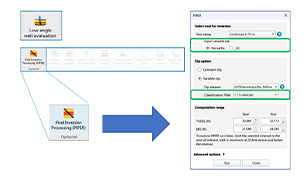
PIPER now offers the following functionalities:
Support of input variables with suffixes (_EC and _RT)
Filter input variable dip according to classifications
Graphical selection of processing interval
LowReP develop end points method enhancements .
Updated hydrocarbon correction logic for density-GR plot.
Hydrocarbon correction is now applied to density for the input points located at the left side of sand-dispersed shale line in density-GR cross plot.
Improvement of the Pickett plot
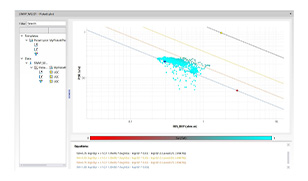
You are now able to use a third curve to color the Pickett plot.
In addition, the water saturation (SW) lines can be hidden by double click on the equations in the plot.
New API to access and manipulate AWI from Techlog or any Python AWI
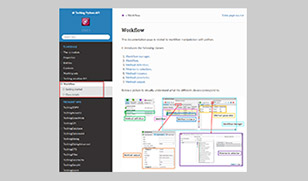
Using this API, users have the flexibility to automate workflows, finding and changing information for the different components of the AWI, including:
Workflow manager
Workflow
Method definition
Mnemonic selection
Method instance
Method parameter
Method output
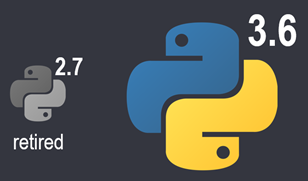
Python Compiler in Techlog has been upgraded from version 3.6 to 3.9, as the support for security fixes in version 3.6 has been suspended.

Techlog continually updates its content, based on the feedback provided by its users via the CustomerCareCenter. More than 100 bugs have been fixed in this version.
High-impact bugs were fixed on the platform side. For example, it is now possible to open 3D plots on PTS when no GPU is present.
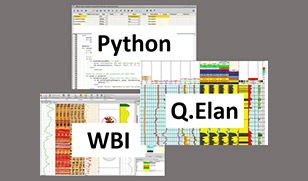
Fixes to address high-impact bugs on Quanti.Elan, Wellbore Imaging and Python were also added.
Quanti.Elan:
Saved workflow templates now open correctly
Unit of salinity parameter is now correctly used by NPHU neutron porosity equation
Variables in the constant tool are now correctly taken into account when working with multiple zones (one model by zone)
Wet clay porosity is now correctly computed by the initializations method in Canadian-unit system
The saved rock model now correctly contains all the selected model components.
WBI:
Bin correction tune in oriented wellbore images
Partial dips and induced fractures are now properly displayed in TOH oriented images
Rotated dips now displaying after running structural dip removal method
Borehole Shape in LogView displays in normal mode
Python:
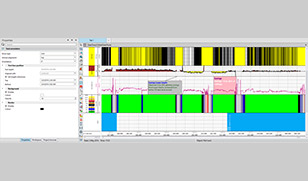
In Techlog 2022.1, we have improved date-time reference handling with a feature that allows the user to display data in LogView in date-time format.
The normalization method compensates log measurements for one or more conditions, including inaccurate tool calibration, drift in the measuring devices, differences in tool response resulting from differences vendors etc.
In the Quanti.Elan solver, you can now use shale resistivity (Rsh) when working with the Dual Water Elan equation.
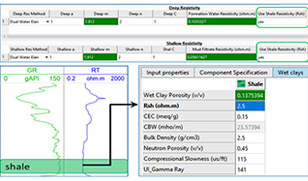
When you choose use shale resistivity (Rsh), the equation uses the shale resistivity parameter—bound water conductivity is computed for each clay from the input shale resistivity, and is used in the computation accordingly.
The Quanti.Elan solver method now provides an option to update for either wet or dry clay endpoints when updating wet clay porosity.
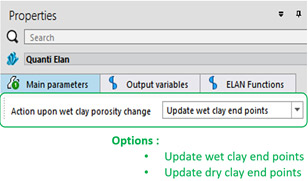
When updating wet clay porosity in the Quanti.Elan solver, you can now choose whether the wet or dry clay endpoints are also updated. This is enabled by a new method property. The default is to update for wet endpoints.
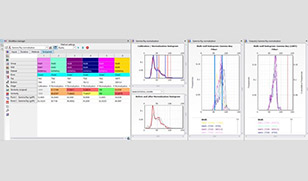
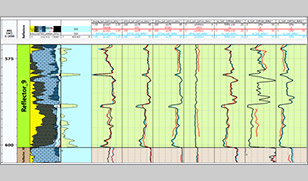
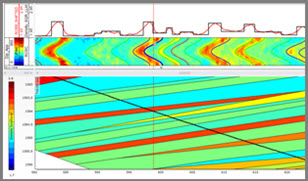
Through the new NMR Single-Depth 2D Map functionality, you are now able to visualize the 2D maps, resulting from inversions run with SLB NMR tools.
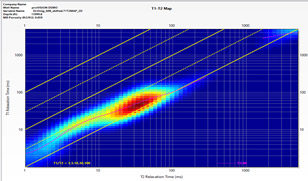
The following maps are supported:
T1 relaxation time vs. T2 relaxation time (T1T2)
Diffusion constant vs. T2 relaxation time (DCT2)
Diffusion constant vs. T1 relaxation time (DCT1)
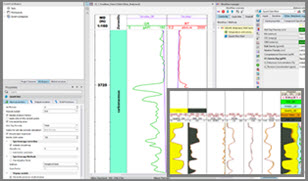
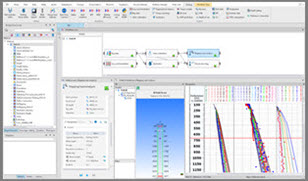
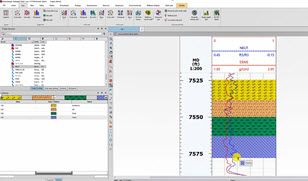
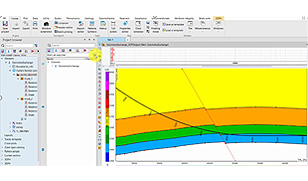
You can now interact with the 3DPH Local Layer Model through the new tabular view.
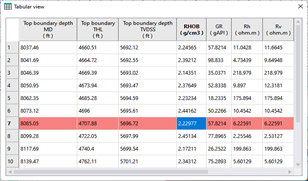
This window hosts the numerical representation of the model. It provides an editable and interactive interface, which is in full synchronization with the model. You can edit individual layer properties, fill up or down a defined layer property to other layers, show or hide certain layer columns, and copy the table content to Excel for subsequent use. These improve your 3DPH Local Layer model workflow efficiency.
Users are now able to create robust rock models in an integrated workflow, allowing parameter optimization for multi-well environments.
The ‘advanced rock modeling’ functionality provides an integrated approach to create rock models for determining elastic and acoustic properties of rocks from petrophysical inputs. The rock model workflow can be used both for single as well as multi-well environments. The functionality also offers an optimization workflow which uses an inversion algorithm to determine optimum rock model parameters to propagate to nearby wells in the field.
Techlog K.mod is brand new in Techlog 2021 and has additional capabilities. It can now support automatic workflow interface (AWI), with the ability to preserve the computational seed property into workflows and apply it to other wells.
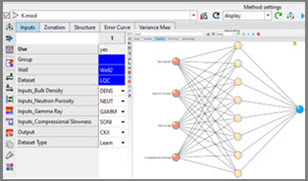
Because Techlog K.mod supports automatic workflow interface (AWI), petrophysicists can use it to preserve the seed property used for computation and save the model in the workflow. The saved model can be applied to another well without having to build the model again.
(*) The Techlog K.mod module extracts essential information from log data to predict nonrecorded parameters (Ф, K) and reconstruct missing or poor quality measurements to compensate for bad hole conditions, environmental effects, acquisition problems, etc.
Embrace new technology updates for an improved user experience and significant productivity improvements with Techlog 2021.
Many technology updates requested by customers are featured in Techlog 2021, including:
Global zonation improvements:
Ability to assign a symbol as a pattern for zones
Collapse / expand buttons added to global zonation tree hierarchy
Use catalog name to group results upon categories conversion
Grouping of global zonations in the Project Browser (PB) is reflected in the dropdown selection
Impacted wells listed to the user when renaming a zone
Full synchronization on zone split between zone editor, automatic workflow interface (AWI) and log view
Zone description and properties visible as a tooltip
HTML copy of the global zonation now considers the hierarchy
New zonation track property adjusts manually the font of zones
CRS catalog update to align with the Petrel platform and Studio platform
Update CRS catalog (ESRII ArcGIS 10.7.1) and engine to 1.5.8 for Petrel E&P software platform, Techlog wellbore software platform and Studio E&P knowledge platform
Use the Studio platform companion XML file instead of the catalague (independent of the engine)
Future update will be smoother as we cannot break the compatibility anymore
Encode Well Known Text (WKT) in the well property and not only authority code
BGGM file updates
Move to support HD BGGM file—2020 format
Fully compatible with previous version
Support the new algorithm precision in the Techlog platform (inclinometry QC WBI)
Better WBI Python menu organization with a better hierarchy
Symbols/patterns management to harmonize the usage of catalogs so petrophysicists can access the full pattern selection window
ASCII import performance improvements with a better management of variable versioning and option to merge datasets with the same sampling rate
Batch importer tool: a standalone tool designed to automate the migration process.
Techlog Calculator is available in Techlog 2021 with improved properties, enabling users to gain meaningful insights into computations and equations.
.jpg?la=en&hash=B07CFAA96FFD668B043D81C3B0632330CB41D8B3)
Techlog Calculator was previously available as a plug-in in the Ocean software development framework. In 2021, we embedded its functionalities into the Techlog Base License. Techlog Calculator bridges the gap between the data editor and math processing functions in the Techlog wellbore software platform.
The new Techlog Calculator enables petrophycisists and geoscientists to drag and drop variables in single and multi-well environments. They can also quickly and easily conduct syntax management with in-built operators, perform proper family assignment logic, using zones in multiple ways and with dual modes of output generation, and create visualizations of unsaved variables—essential for validating any field specific correlation. The equations formed can be saved and reused in the future.
In addition, the new version of Techlog Calculator includes “Endpoint Calculator” which enables the computation of essential petrophysical parameters for advanced interpretations.
Techlog Calculator summary:
Easy and quick computation of data for single/multi-well environment.
Variable(s) drag & drop operation for input selection.
On screen operator buttons for efficient syntax management.
Allows equations to run either on full interval, user-specified intervals, available project zonation or on intervals created by interactive selections.
Options to display unsaved outputs in LogView.
Automatically applies family assignment rules if output family and unit are missing in the computation.
Outputs can be generated either via ‘update’ or ‘overwrite’ mode.
Equations can be saved and reused as per user requirements.
Differentiate and quantify gas-filled porosity from liquid-filled porosity and very low porosity formations, with the Quanti.Elan* multicomponent inversion solver. Use shale trendlines for inversion computations.
Techlog 2021 enables petrophysicists to incorporate fast neutron elastic scattering cross section (FNXS) and neutron porosity (TPHI) measurements from the Pulsar multifunction spectroscopy service into the Quanti.Elan multicomponent inversion solver. The measurements are associated to linear response equations in the Quanti.Elan solver and help differentiate and quantify gas-filled porosity from liquid-filled porosity or very low porosity formations.
Petrophysicists can assign a variable to the shale resistivity and a variable to the wet endpoint, for the clay minerals specified in the Quanti.Elan solver model.
Quanti.Elan solver uses the variable parameters for the computations accordingly. This new functionality enables shale trendlines to be used for the mineral and fluid inversion process.
*With the Quanti.Elan solver, petrophysicists can save and then easily reapply models to new data—the ability to combine outputs from several models improves the accuracy of final results.
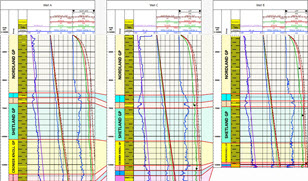
With Techlog 3D Petrophysics, petrophysicisits can fine tune the local layer model through synchronization between the dip sinusoids and the model. They can also auto-populate tool settings and borehole parameters, to enhance the user experience.
Techlog 2021 develops the possibilities in Techlog 3D Petrophysics synchronization. Petrophysicists are now able to fine tune the local layer model through new synchronization features which link the dip sinusoids to the model. The local layer model can be created and enhanced in just a few clicks, through visual guidance of the sinusoids.
Techlog 3D Petrohysics tool setting and borehole parameters, such as mud density and hole diameter, can be automatically populated from the properties of the measured logs.
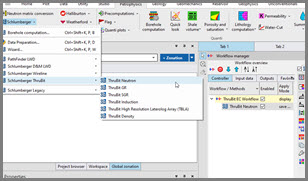
Techlog 2021 now supports processing and environmental corrections of ThruBit through-the-bit logging services measurements, including gamma ray, spectral gamma ray, neutron, density, induction resistivity and laterolog resistivity measurements, in addition of SLB Logging While Drilling (LWD) Services. All adnVISION* azimuthal density neutron service environmental correction methods have been updated (inputs and parameters). This is fully aligned with the enhancements and upgrades performed on the log data acquisition system.
*The adnVISION provides azimuthal borehole compensated formation density, neutron porosity and photoelectric factor measurements.
Techlog Drilling Interpretation plug-in in Techlog 2021 connects DELFI Drilling Interpretation features to the Techlog wellbore software platform. Users can perform cross-domain workflows and can also connect to the DrillOps on-target well delivery solution.
Techlog Drilling Interpretation brings workflow engine technology to process real-time data stream in the Techlog platform. The workflow enables users to:
Continuously run in real-time defined computational engine
Rig activity and KPIs
Torque and drag model
Equivalent Circulating Density (ECD) the model (it should be higher than Pore Pressure, lower than Fracture Gradient)
Downhole Mechanical Specific Energy (MSE) computation
Customize workflows
Add RT Python capability with Python Workflow Engine (PyWE): Workflow Engine is an evolution of the AWI4 technology for Real Time
Define computations to be run in series or in parallel
Additionally, users can access and manage the contextual information of the well such as:
Wellbore geometry
Bottom Hole Assembly (BHA)management
Fluid properties
The annotation process is optimized in Techlog 2021.1, delivering significant time savings, with easier way to annotate logs
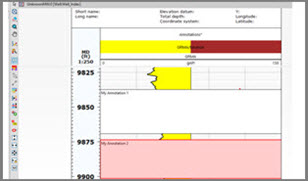
Previous improvements to lithology and symbols management in the Techlog wellbore software platform have lead the way to the optimization of the platform’s annotation capabilities.
Using Techlog 2021 geoscientists can:
• Create annotation on any track
• Define annotation for a single depth or a depth interval
• Define background and border colors
Techlog Studio new improvements make users more productive with ‘drag and drop’ and ‘data lock’ features
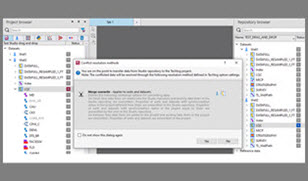
With Techlog Studio 2021, geoscientists can:
Lock the data entities displayed in their project.
Drag and drop data entities from the project browser to the repository browser and vis-versa, with the ability to select a conflict resolution method by default.
See all the 2021 release features
It is now possible to create, edit, and classify lithology using the discrete value palette.
Enable advanced customized workflows and access extensive python libraries.
Calibrate the pore pressure interactively to improve your analysis results.
Calculate minimum and maximum horizontal stresses in a single workflow.
Improve the accuracy of your Petrel structural model, by integrating your geometry from Techlog 3D Petrophysics.
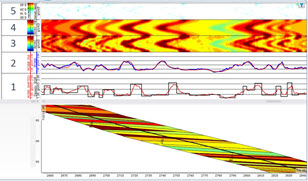
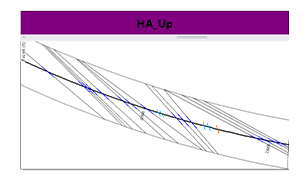
Techlog 3D Petrophysics—high angle well evaluation workflow enhancing density inversion.
Enable the individual contribution of boundary dip or invasion for improved log responses.
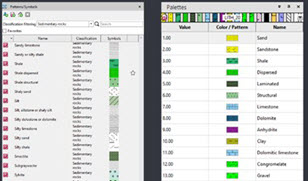
The catalogue management has been simplified by merging patterns and symbols into one window.
To simplify the geologist’s journey in the Techlog wellbore software platform, we introduced a new way for users to create palettes:
We continue to improve the overall usability of the software providing an easy way to create and brush lithology or any general flags.
You can now use your palette to create your lithology:
Python 3.6 enables advanced customized workflows with improved stability.
With Python 3.6:
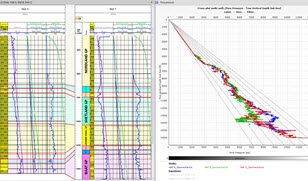
Visualize results in the regular Logview window and compare the results in a pressure versus TVDSS cross-plot, for a clear overview of the model with respect to the observations.
Calculate pore pressure for different lithology types (either shales or non-shales), and compare the results using the cutting-edge visualization tools available in the Techlog platform, to verify whether the observations match the model results, and provide predictive models for your field developments and exploration wells.
Calculate minimum and maximum horizontal stresses using industry recognized workflows.
Depending on the available information, horizontal stresses may be calculated either as a simple relationship between the vertical effective stress and the horizontal effective stress (effective stress ratio method) or using the theory of poroelasticity, which requires elastic properties, or as simple as a proportion of the minimum horizontal stress.
As a user you will be able to calculate the minimum and the maximum horizontal stresses in a single workflow.

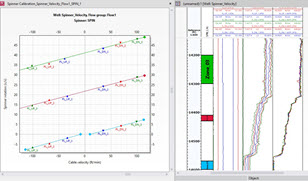
New spinner calibration workflow with improved usability to compute fluid velocity.
A new spinner calibration workflow with improved usability is now available in the Techlog wellbore software platform to compute fluid velocity:
Exchange results between Techlog and Petrel is now possible.
Integration of structural models into high angle well evaluation workflow is now possible You can import the curtain section geometry point sets generated in the Petrel E&P software platform into the Techlog wellbore software platform and load them to 3DP-High angle well evaluation for global layer geometry initialization.
The curtain section geometry point set could have been created in:
The loaded geometry can then be used for construction of the layered earth model.
This workflow will enable you to efficiently integrate your structural modeling with high angle well evaluation workflows in 3DP.
Techlog 3D Petrophysics also allows you to build layered earth models to derive the true formation layer properties. The process involves use of logs, borehole images, and boundary mapping technology information to create formation geometry and layer log properties. The resulting formation layer geometry can be exported as point sets and used in the Petrel E&P software platform to update the structural models.
You can now add accuracy to your structural models through integration of the geometry interpreted in Techlog 3D Petrophysics.
Use borehole images to guide accurate and automatic definition of formation layer geometry and density/PEF properties.
You can use borehole images measured by the EcoScope multifunction logging-while-drilling service and the adnVISION azimuthal density neutron service to automatically define local layer models consisting of layer geometry and density/PEF properties. The density inversion functionality ensures accurate and efficient definition of the model in a reasonable time frame.
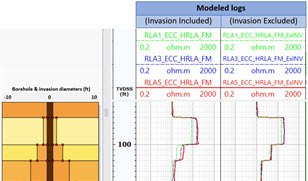
Techlog 3DP enables you to evaluate the individual contribution of boundary dip or invasion into the forward modeled responses. You can now use the resistivity modeling mode to achieve this, choosing one of these three options:
Use defined model: Forward modeling is performed on the defined formation model. The model dimensionality flags show where dip or invasion effects are honored. They also show the quality of the invasion modeling.
Exclude invasion: Forward modeling is performed on the formation model while assuming that the entire interval is uninvaded. 3DP uses the 1D+Dip code to model the responses.
Exclude dip: Forward modeling is performed on the formation model while assuming that boundaries are perpendicular to the well trajectory. 3DP uses the 2D code to model the responses.