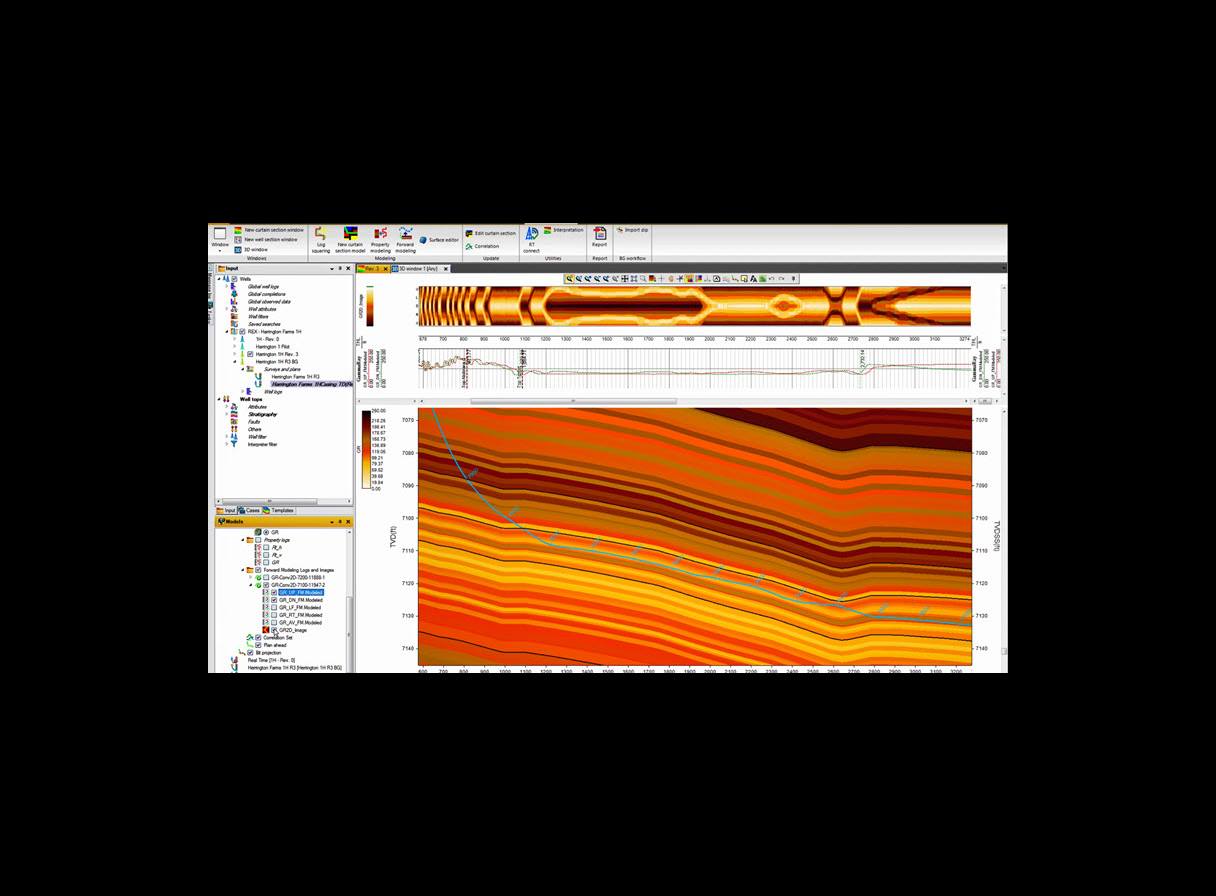
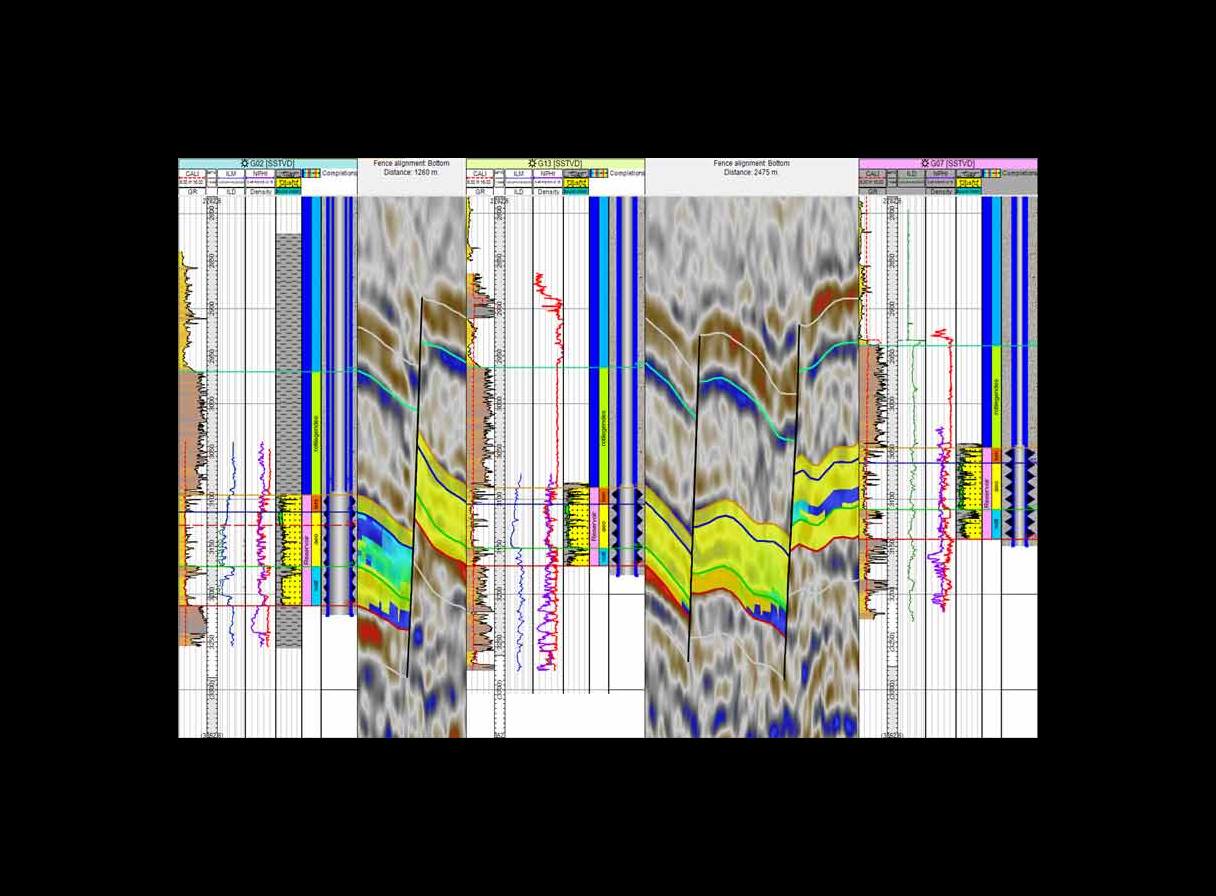
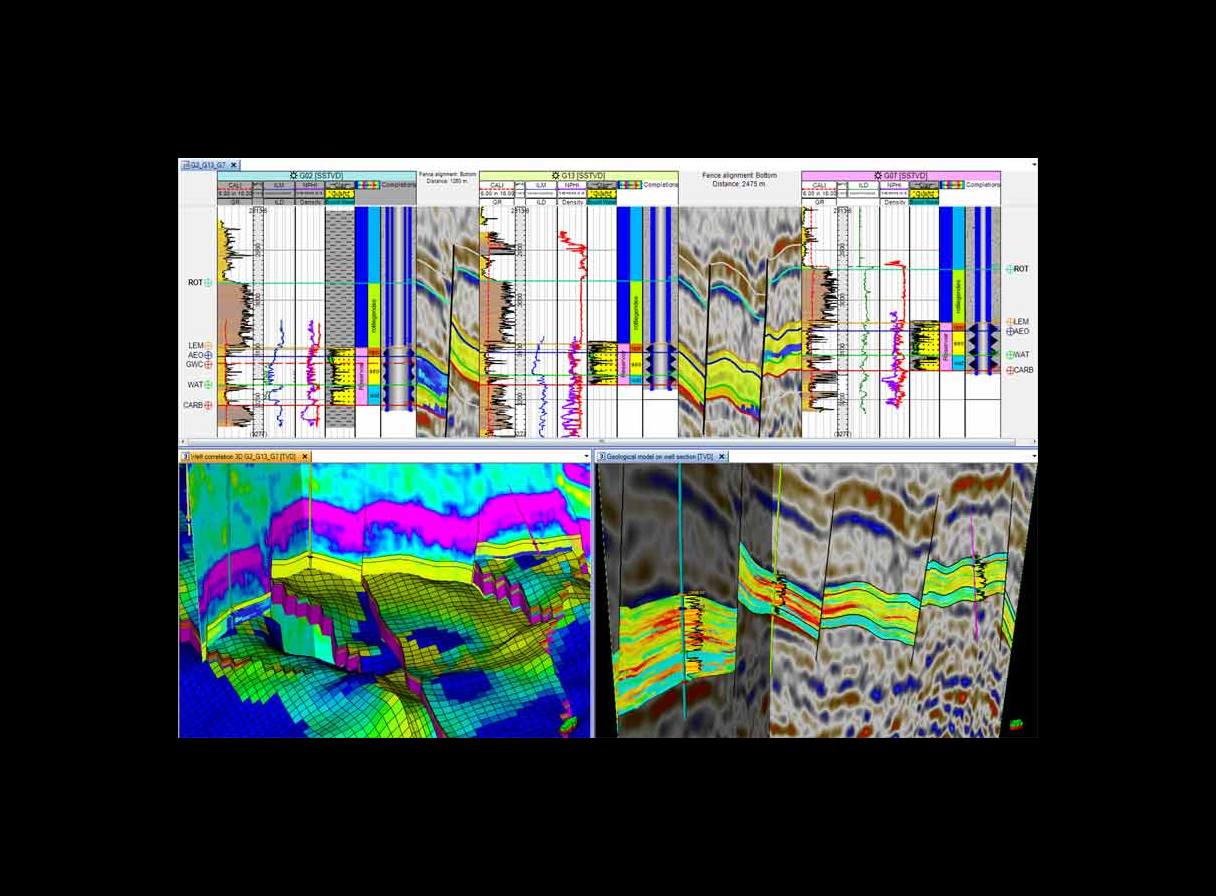
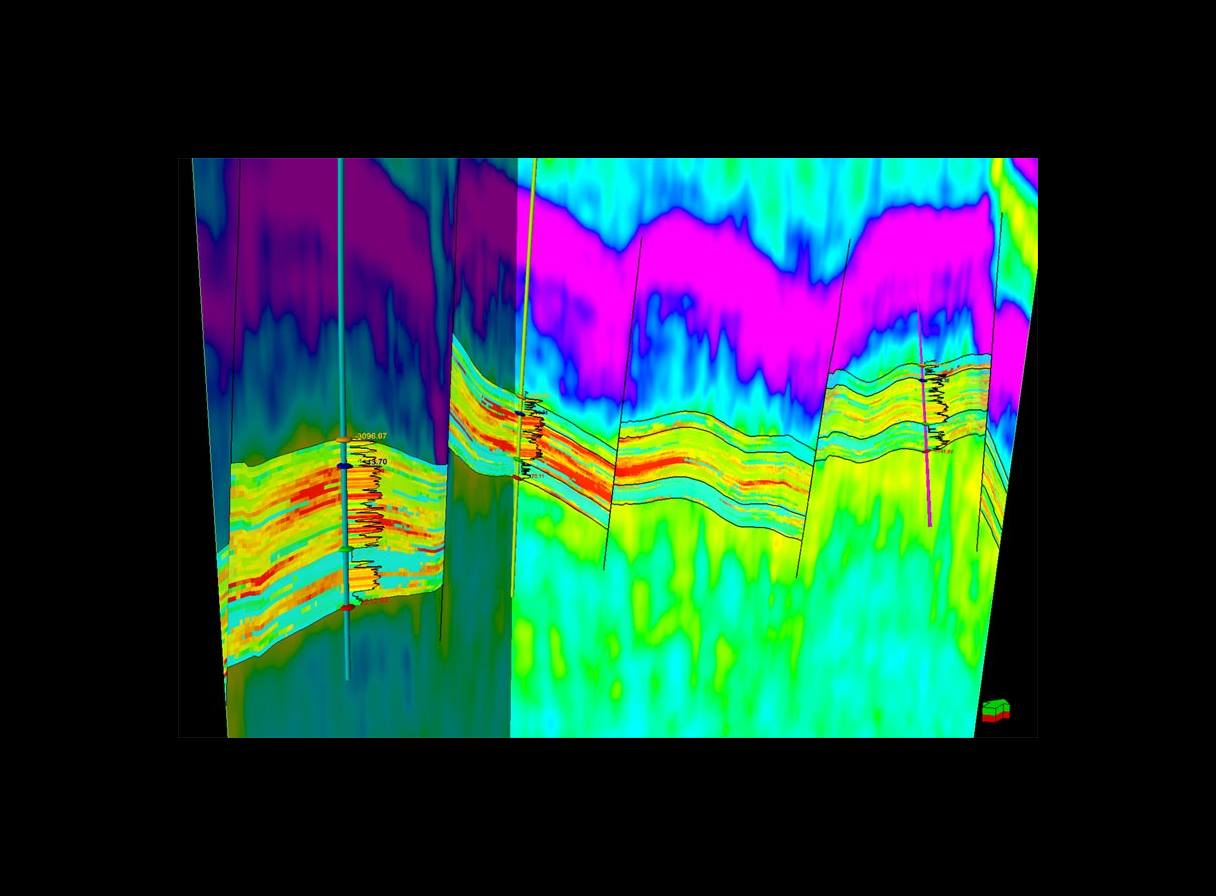
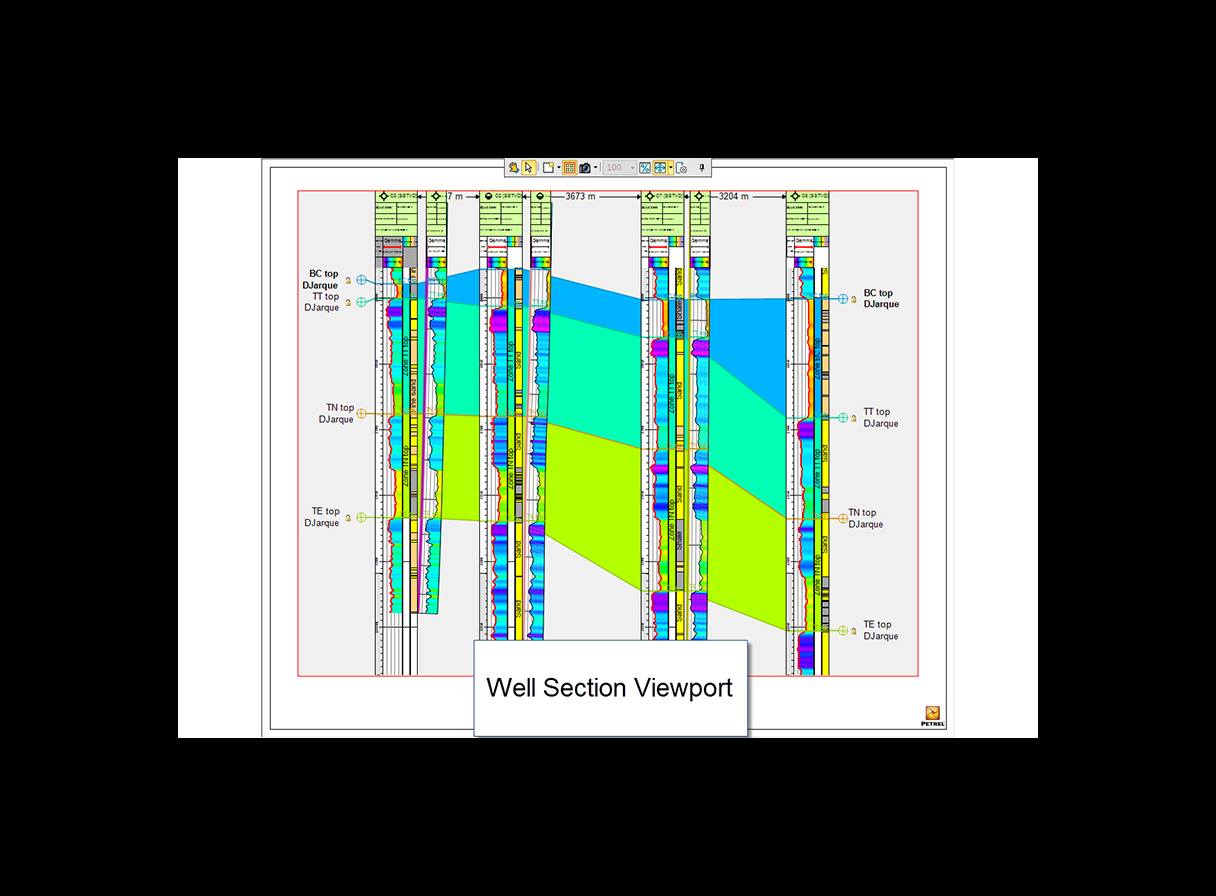
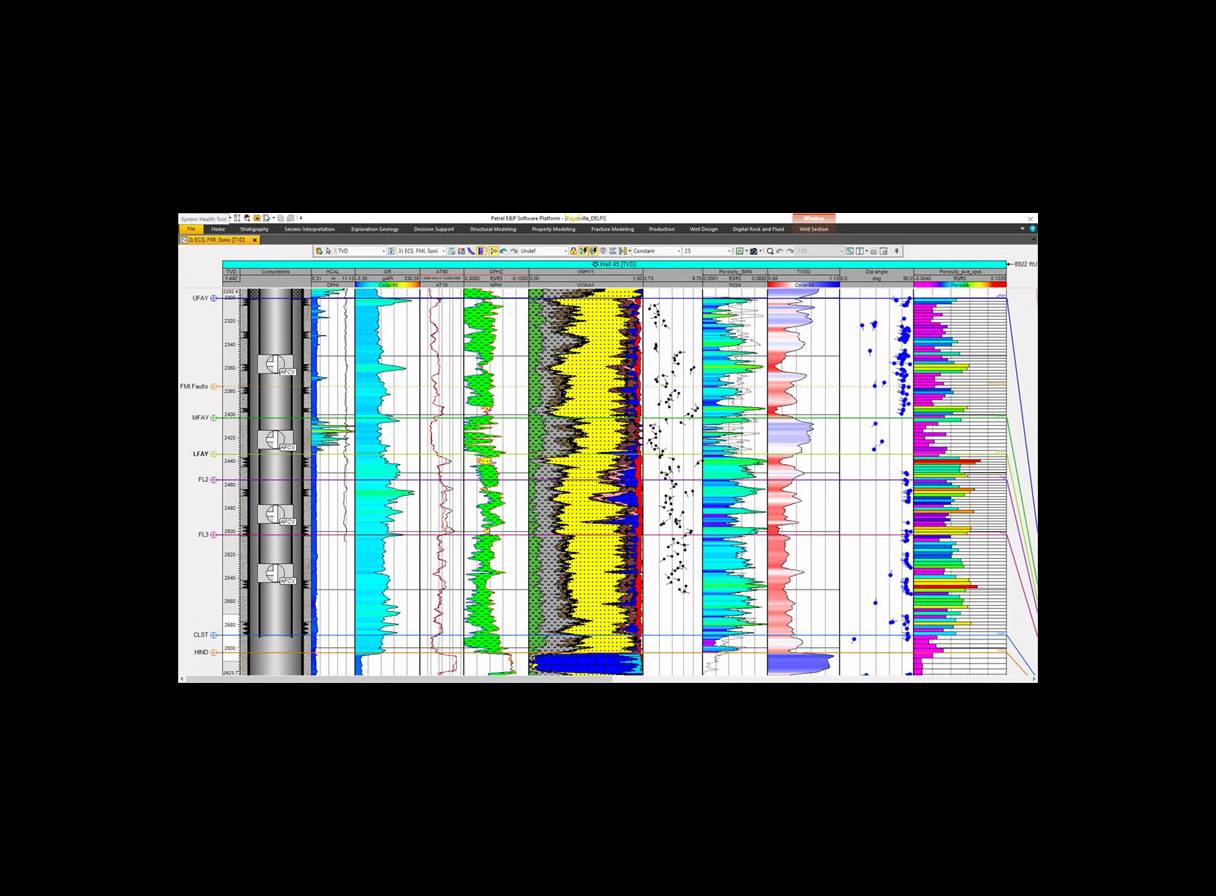
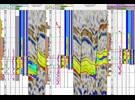
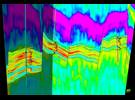
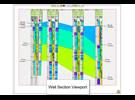
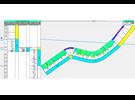
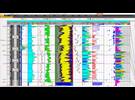
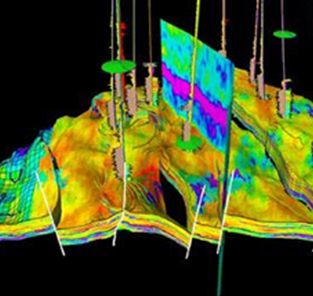
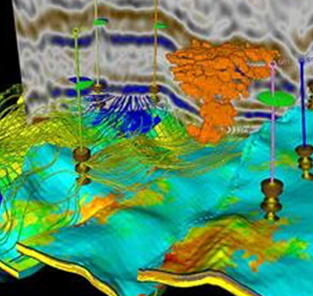
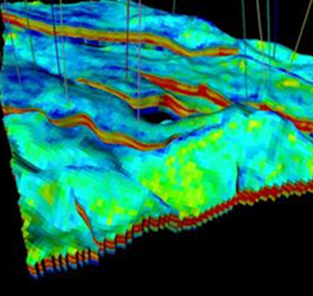
Petrel well correlation provides a clean correlation canvas on which to display logs, core images, seismic data, grid data, and even completions and simulation results—which can be played through time. Users can geosteer horizontal and highly deviated wells with SLB LWD tools in real time, and deviated wells can be displayed overlain on seismic or 3D grid properties.
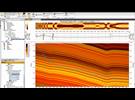
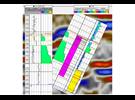
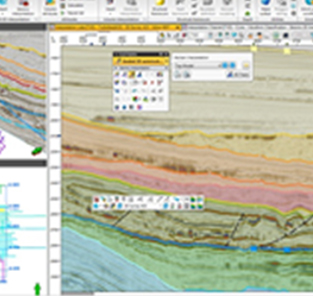
Cross sections can be interactively created and shared across projects and also be directly edited in the 2D or map window. Tools for picking markers, estimating logs by trained neural networks, and performing interactive log conditioning enable robust stratigraphic interpretation. The advanced visualization performance easily handles thousands of wells simultaneously.
Features
- Interpret discrete properties interactively
- Automatically or manually pick and edit well tops on the cross section in interpretation and intersection windows and see the effects directly in 3D
- Edit existing logs or generate new ones from any number of curves by using the powerful well log calculator, log editor, or interactive log conditioning toolbar
- Generate ghost curves for multiple logs simultaneously with stretch, squeeze, and inversion tools and automatic drop of markers
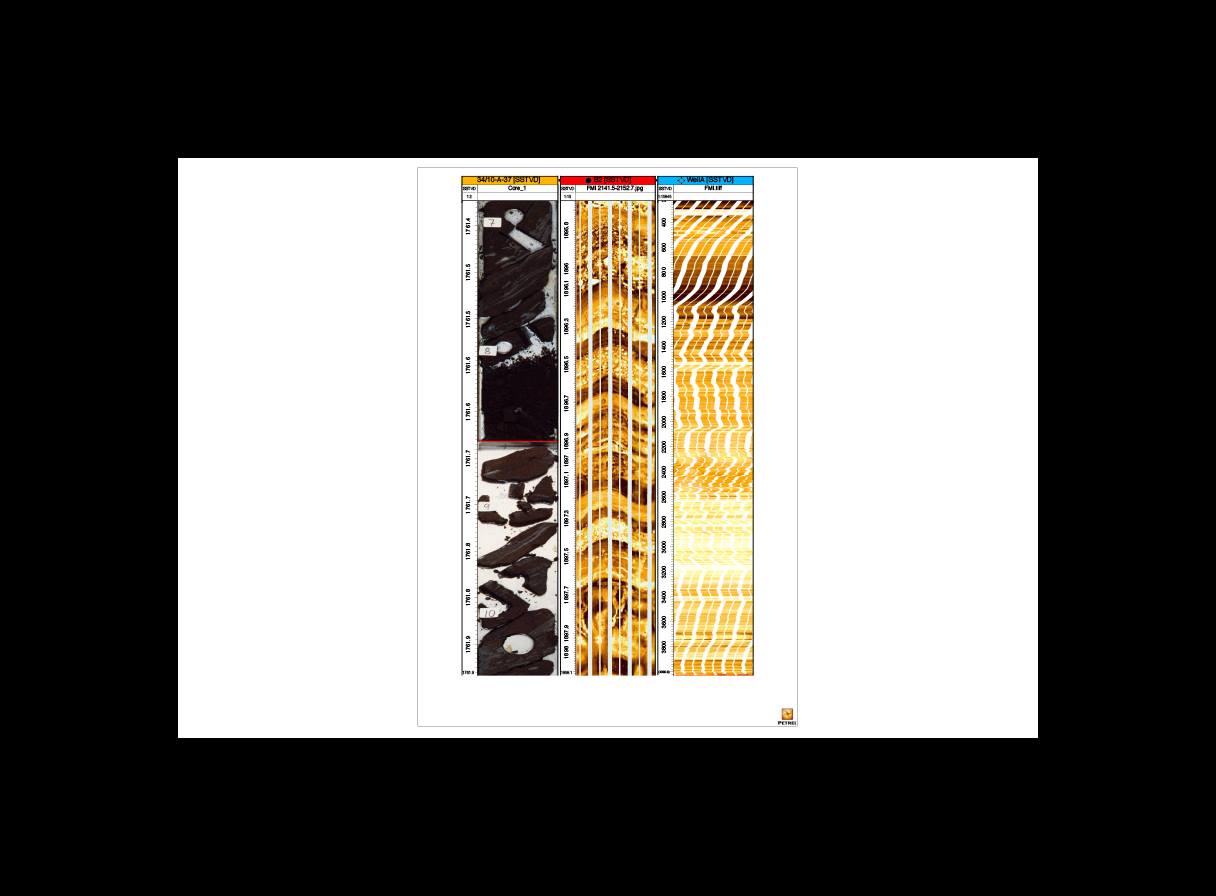
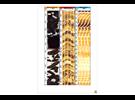
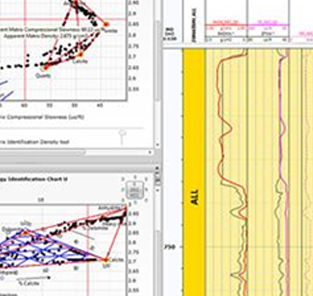
- Display logs, core images, point data, image interpretations (rose diagrams and tadpoles) from the FMI fullbore formation microimager, FMI-HD high-definition formation microimager, Quanta Geo photorealistic reservoir geology service, checkshots, and synthetic seismograms
- Interpret raster logs with high resolution
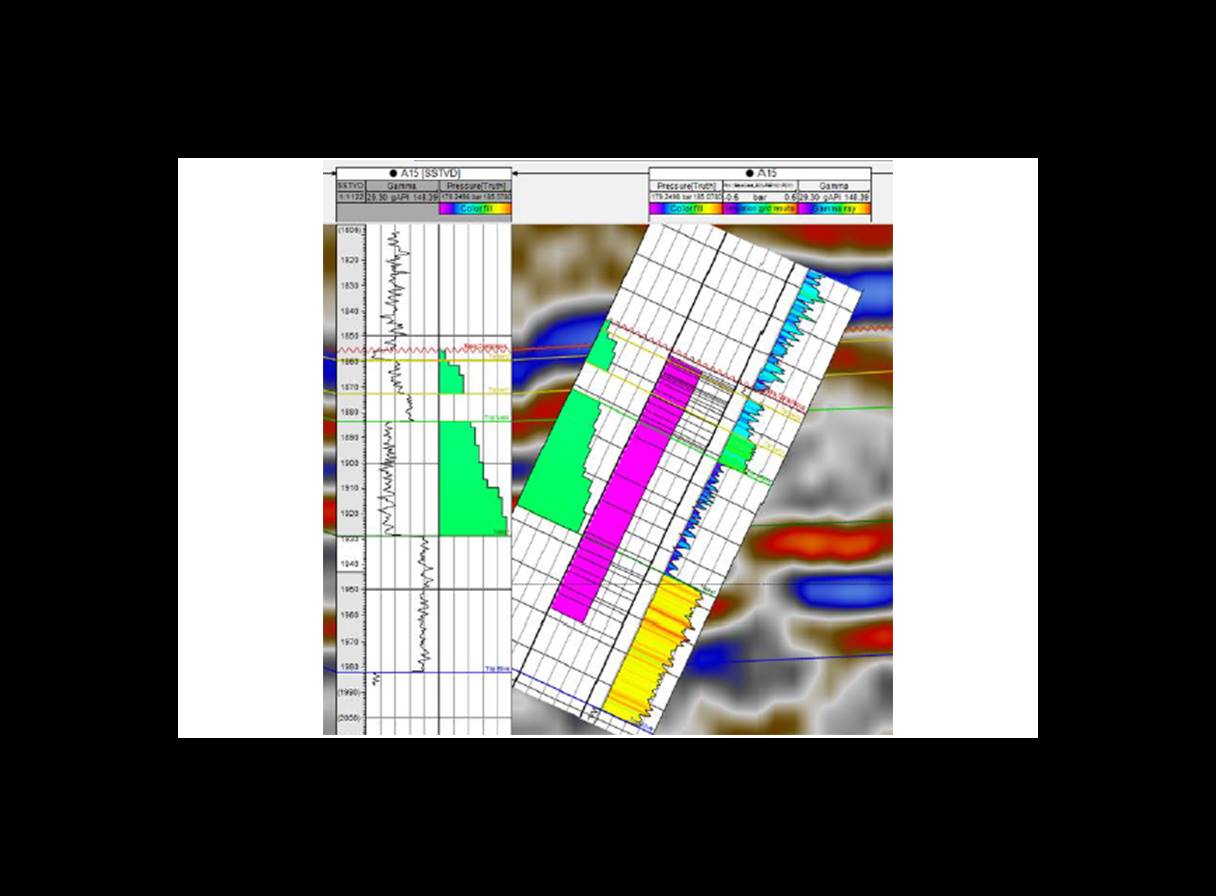
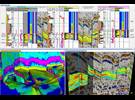
- Create backdrop seismic data, generic surfaces, 3D grid geometry, 3D grid properties with optional transparency, completions, and simulation results with an associated dynamic time player
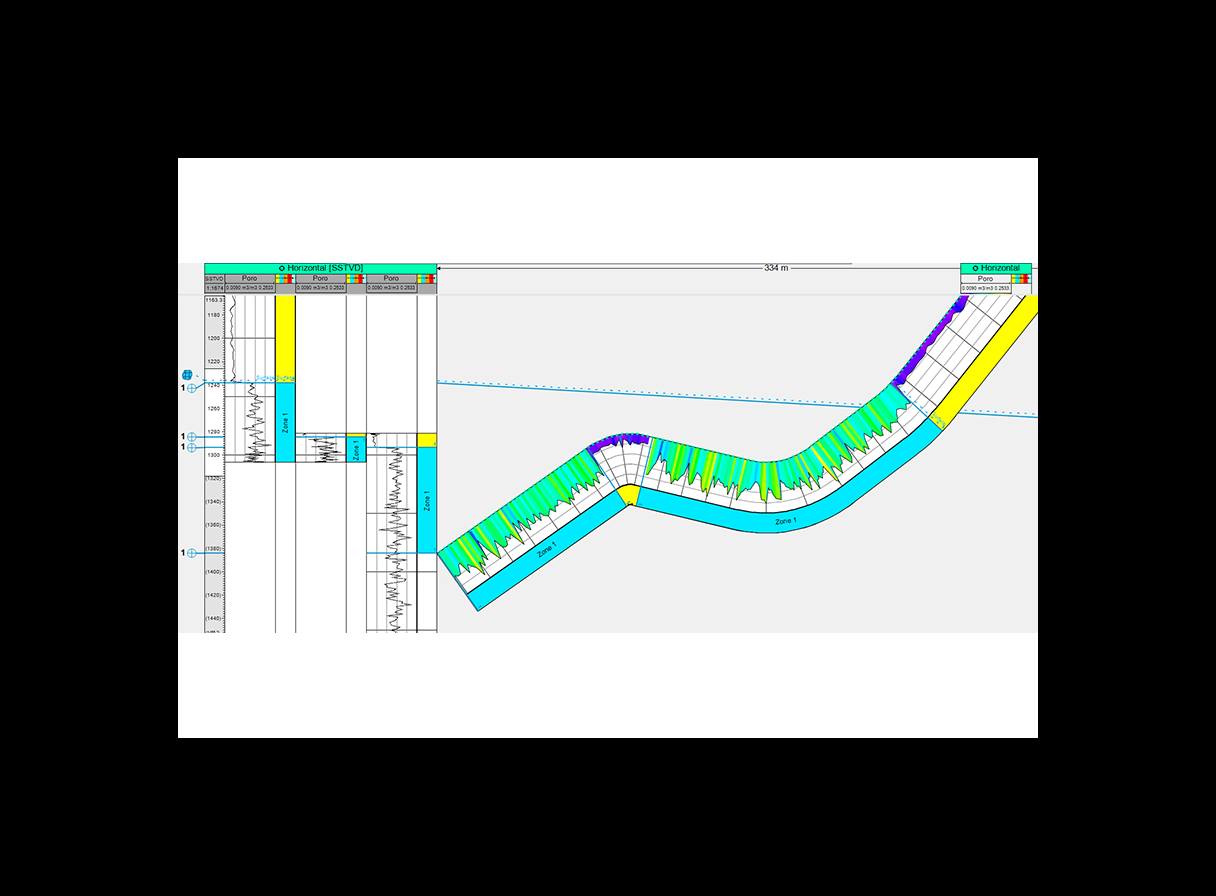
- Visualize and interpret on deviated wells in the cross section
- Geosteer horizontal and highly deviated wells in real time with displays of multiple measurements, numerous surfaces or horizons, and borehole images in a single canvas