Order Leadtime - Predict the Unpredictable
A Critical Measure of Supply Chain Performance
To manage a high-performance supply chain, it is critical to understand exactly when products will be delivered and what the lead time for their delivery is. Lead time in this context is the period from when a customer expresses a requirement, to the point those goods are delivered to the final destination.
In Schlumberger, the planning and supply chain teams support operations in service delivery through managing the extended supply chain, including supplier management, strategic sourcing, logistics and inventory management. One of the key challenges in managing this supply chain, is the uncertainty with the expected deliver date (EDD). There are real-world business consequences to this, including the need to maintain higher inventory levels to ensure an appropriate service level.
When ordering a lightbulb or some dog food on Amazon.com, you would be 99% certain to receive it on the delivery date they tell you. The supply chain for this is uncomplicated—usually just a local warehouse to your door via a courier. This is not really the case when you order a submersible pump in the North Sea, explosives in Nigeria or a drill bit in Columbia. For Schlumberger, the supply chain of a single product often involves multiple countries and complex processes to manage international trade regulations, multiple modes of transport and local delivery requirements.
We describe this demand to delivery life cycle with the following stages or ‘legs’:
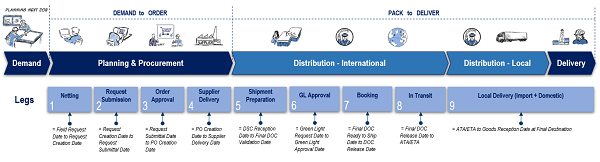
In addition to the complex routing, the lead time for each leg is influenced by various parameters like type of goods (hazardous vs non-hazardous), mode of transport, final destination country, etc. In the current state, a database containing estimates of the lead time of each route (and each variant) was built to provide an estimate of the total delivery time and expected delivery date. It was immediately obvious that maintaining all these combinations manually was an impossible task, with over 12 million potential scenarios and 4.1 million active ones.
With active transactions on around 4,100,000 records, and manually updating lead times in the database being impractical, the estimates for each leg were rarely updated, resulting in inappropriate delivery date estimation.
To solve this problem, a machine learning solution was deployed to predict lead times, based on historical transaction data. Multiple machine learning models were evaluated using five years of transactional data:
-
Linear regression
-
K-means
-
Random forest
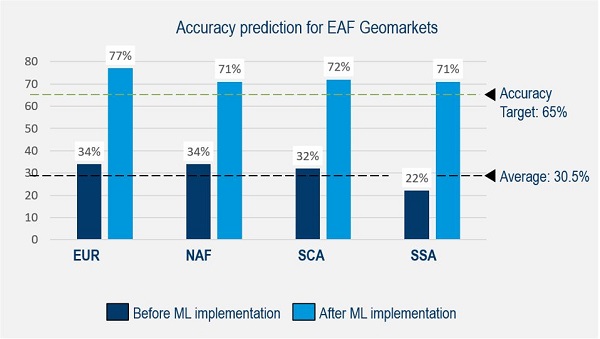
Advanced models like Gradient Boosting Estimator have proven to be very effective, resulting in improvement in accuracy from 30% to 73% for predicting the expected date of delivery (EDD), as illustrated in the example below, demonstrating the impact for Europe and Africa.
Even with this dramatic improvement, we found there were limitations to improving the prediction accuracy, due to the limited set of input variables initially used.
It is important that the lead time for each of the intermediate legs stays relevant as the order moves through the order life cycle, as a lot of factors will continue to influence it throughout the process. Multiple variables from different business systems, across each leg, were explored based on inputs from supply-chain subject matter experts, and potential new features were derived based on these inputs.
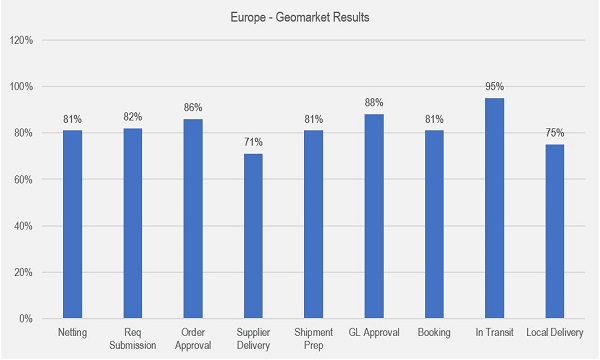
With these revised inputs, the machine learning model delivered outstanding results. An average accuracy of 82% in the forecasted lead time was achieved across the overall ordering to delivery process, as well as for each individual leg.
Authors information:
Luke van der Waals
Luke leads the Operations System Performance team for Supply Chain, responsible for ensuring the supply chain function performs as impactfully and efficiently as possible. Having managed supply chain operations in the US, Europe and Asia, he understands that the best run supply chains combine the unique strengths of people and technology, each augmenting the other to deliver greater performance.
Jairaj Shetty
Jairaj is a product guy, delivering a portfolio of artificial intelligence (AI) and machine learning (ML) products addressing internal business pain points. He has delivered products across Supply Chain, Operations, and Tool Reliability domains. Having spent over a decade delivering upstream oil and gas services in field and customer facing roles, he strongly believes uncovering data patterns and drawing meaningful insights using advanced AI/ML techniques can have significant impact with business gains, and he strives to achieve the same in the products he and his team builds.
Raj Kumar
Raj is a data scientist in Analytics Studio, PITC focusing on delivering ML solutions in the supply chain domain. He has a masters degree from National Institute of Technology, Rourkela and IIT, Kharagpur.