From ML to Explainable ML - How it Applies to Drilling Tools
Imagine you worked for weeks on your application for admission to Grad School. Based on your credentials, you’re convinced your admission is a done deal. However, to your big surprise, the Admissions Department emails you saying you didn’t make the cut. The small print in the email says that starting this year, admissions decisions rely 100% on the “revolutionary ML-based process” developed by researchers at the same university.
Shoot! Now on top of your disappointment you have tons of questions–how are decisions made by this machine learning (ML) tool? What were your weak points compared with other applicants? What can you improve to increase your chances for next year?
As ML models are increasingly finding their way across industry and society in general, there is a growing need to justify how and why these models provide specific outcomes. I can easily understand why we prefer models that, in addition to producing accurate predictions, these predictions can be justified or “explained”. In contrast to physics-based models, ML models are mostly “black boxes” and therefore to explain their predictions is extremely challenging. From my experience, the collaboration between data scientists and subject-matter-experts (SMEs) gets a lot more productive when model outcomes are explained, and these explanations match SME’s intuition–trust in the modeling process and outcomes increases dramatically.
Fortunately, over the last few years, the ML/AI community has developed methods to explain model predictions, giving rise to the Explainable AI (XAI) area of research. SHAP (SHapley Additive exPlanations) is one popular XAI method with a solid math foundation and an efficient implementation. Next, I will describe a successful application of SHAP to explain mechanical events for a widely used Schlumberger drilling tool.
The lower the mud, the higher the event probability...or is it?
The event diagnostics algorithm was developed in a joint effort, between some of our SMEs based in the UK and data scientists in the US, to detect and classify events in five different categories, including continuous and intermittent events. The algorithm development relied on run-data from thousands of time-series available at our data store. Portions of these time-series were manually “labeled” by different SMEs covering all event categories. Since the time needed to label this volume of samples was impractically long, two innovative steps were taken: (1) a labeling workflow was put together based on a time-series visualization tool and (2) the number of samples to be labeled was substantially lowered by implementing Active Learning–an ML technique to iteratively select/prioritize samples. These steps cut the labeling time by about 80%. The diagnostics algorithm developed and validated from these samples involves a sophisticated logic triggered by a handful of sensor readings, which proved to be very accurate.
Once this diagnostics algorithm was deployed, some of our key Schlumberger stakeholders were very keen on “explaining” the detected events in terms of drilling parameters, including different mud properties, flow rates, and borehole temperatures. To this goal, the detection outcomes provided by the diagnostics algorithm for some 15,000 runs were used as “labeled events” to train an ML model to output event probability as a function of drilling parameters. This model was later explained using SHAP.
Figure 1 summarizes our SHAP results for the more than 3,000 cases that were classified within a particular event category by our diagnostics algorithm. Mud density is the top factor determining this event category, followed by borehole pressure, maximum borehole temperature, and so on. For instance, the color-coding means that the higher the value of mud density (i.e., the closer to the red color the dots are), the higher the event probability (impact on the model output on the x-axis). On the other hand, for example, the lower the value of mud water content, the higher the event probability.
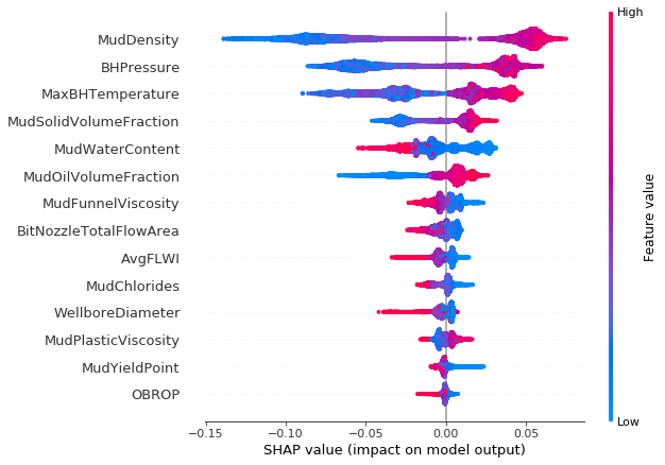
Fig. 1 The SHAP value.
In Figure 2, the blue bars show the event rate as a function of mud density measured in pounds per gallon (lbm/galUS). This even rate is computed via our diagnostics algorithm for 10 intervals (bins) of mud density, spanning from the lowest to the highest possible lbm/galUS. The bar attached to the right of each one of the blue bars indicates the main drivers for these cases–that is, they capture the leading contributors to these events corresponding to each one of the mud-density bins. It is evident from the chart that the four bins corresponding to higher-density muds, the main driver is the mud ppg itself. The leading factors are much more diverse for low ppg muds and include Borehole-Pressure and Average Flow Rate.
Based on the results in Figure 2, our Operations Integrity organization recently issued a field communication with updated recommendations on tool configurations for high mud densities.
To conclude, I would emphasize that Explainable AI can, and should, be applied to many other cases across the industry to build trust in using ML models and increase their efficiency.
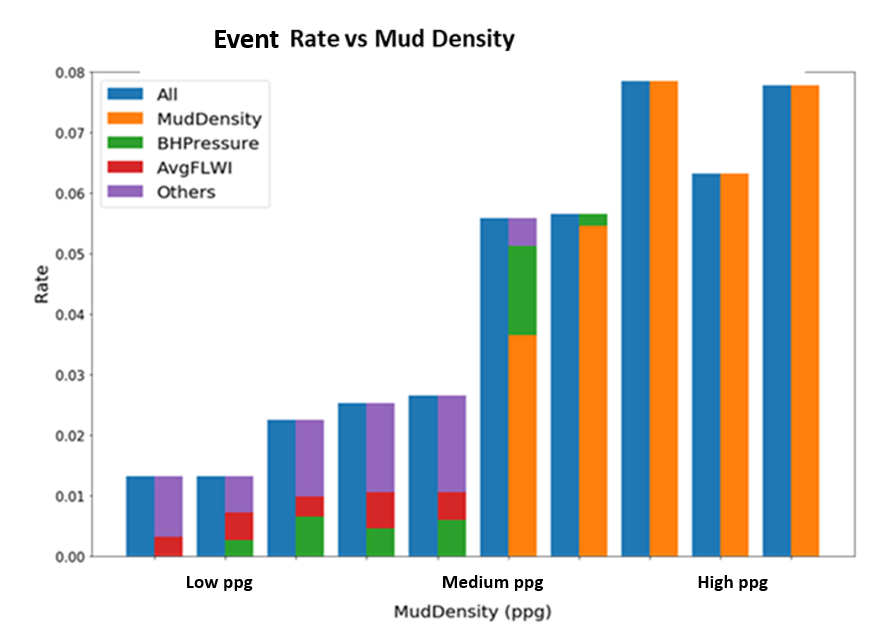
Fig. 2 Event rate compared with mud density.